• Our booking engine at tickets.railforums.co.uk (powered by TrainSplit) helps support the running of the forum with every ticket purchase! Find out more and ask any questions/give us feedback in this thread!

Overall transport use change since March 2020 statistics

Status
Not open for further replies.

philosopher

Established Member
Joined
23 Sep 2015
Messages
1,349
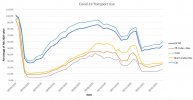
As some of you may know, the Department for Transport have been tracking how transport use has changed since the start of the pandemic. I have done some analysis of the DfT statistics and calculated an overall non freight transport use index based on 2019 mode share for distance travelled. 83% of the index comes from car journeys, 11% from National Rail and the rest is from bus and tube. I have excluded cycling as cycling appears to be very seasonal and a lot of it may be done for purely leisure purposes rather than to go from A to B.

Here is a graph showing how transport use has changed since the start of March 2020:

Transport Use.JPG
The statistics show:
  • Transport use was lowest for the week ending the 12th April 2020, the week of Easter during the first lockdown, with transport use only at 27% of normal.
  • Overall transport use began to recover at the end of April, however train, bus and tube travel remained at very low levels throughout May and only really started to recover in June.
  • Transport use was closest to normal in September, reaching 87% of normal in the week ending 20th September 2020. This coincides when national restrictions were at there lightest and the schools were back.
  • Transport use gradually fell throughout late September and October as restrictions tightened once again.
  • Transport use for all modes, at about 63% of normal was a lot higher during the November lockdown then the Spring 2020 lockdown.
  • Transport use during the current lockdown fell to 47% of normal, similar to that of the second half of May, however it has been creeping upwards since then. For the third week of February it was at 54%.
  • Throughout the pandemic public transport has fallen a lot more than car use, with train and tube use falling the most.
DfT transport use data during the pandemic comes from here:

Transport use during the coronavirus (COVID-19) pandemic​

To monitor the use of the transport system during the coronavirus (COVID-19) pandemic. DfT provides statistics on transport use by mode.
DfT mode share statistics come from here:

Modal comparisons (TSGB01)​

Data about passengers, travelling to work, casualty rates and employment occupations, produced by Department for Transport.
 
Sponsor Post - registered members do not see these adverts; click here to register, or click here to log in
R

RailUK Forums

YorkshireBear

Established Member
Joined
23 Jul 2010
Messages
8,686
The 87 percent makes no sense, how can the UK overall be higher than any of its constituent parts? Or does that inlcudine car too?
 

yorksrob

Veteran Member
Joined
6 Aug 2009
Messages
38,932
Location
Yorks
It's interesting that non-London bus appears to have recovered more than rail. I suspect that this may have something to do with rail being hampered by traditionally being for medium and longer distance travel, which is being more heavily discouraged.
 

Watershed

Veteran Member
Associate Staff
Senior Fares Advisor
Joined
26 Sep 2020
Messages
12,041
Location
UK
It's interesting that non-London bus appears to have recovered more than rail. I suspect that this may have something to do with rail being hampered by traditionally being for medium and longer distance travel, which is being more heavily discouraged.
There's probably also a greater percentage of bus passengers that can't work from home.
 

philosopher

Established Member
Joined
23 Sep 2015
Messages
1,349
The 87 percent makes no sense, how can the UK overall be higher than any of its constituent parts? Or does that inlcudine car too?
Yes, the 87% figure includes car travel which has recovered a lot better than rail and bus. I have not included car travel in the graph as the line would be very close to the UK all line as most travel is car travel.
 

YorkshireBear

Established Member
Joined
23 Jul 2010
Messages
8,686
Yes, the 87% figure includes car travel which has recovered a lot better than rail and bus. I have not included car travel in the graph as the line would be very close to the UK all line as most travel is car travel.
Ah thanks for clarifying!
 

Bikeman78

Established Member
Joined
26 Apr 2018
Messages
4,537
Yes, the 87% figure includes car travel which has recovered a lot better than rail and bus. I have not included car travel in the graph as the line would be very close to the UK all line as most travel is car travel.
My observations agree with the graph. Cardiff Central and the square in front of it are deserted most of the time. Whereas there were queues at some bus stops yesterday. Cardiff Bus is still running a reduced trimetable which means hourly on various routes on Sundays. There's a steady stream of cars on all main roads.

As I mentioned in another thread, Belgian trains are still busy. We've really hammered public transport in the UK.
 

philosopher

Established Member
Joined
23 Sep 2015
Messages
1,349
Here is an update to the DfT transport use statistics since three weeks ago.

Capture.JPG
  • Car use is now at 70%, up from 60% three weeks ago.
  • Train use is at 21%, up from 17% three weeks ago.
  • TfL tube and bus use is at 30%, up from 25% three weeks ago.
  • Non London bus use is at 38%, up from 28% three weeks ago. There is a particularly big increase from 31% in the last week alone which is probably due to school pupils using buses again.
  • Overall transport use adjusted for 2019 mode share is now at 64%.
Comparing the transport recovery to the easing of lockdown last spring / summer, car use is now at similar levels to mid June, while public transport use is at similar levels to mid July. Public transport is recovering faster this time round than it was last spring / summer.
 

Attachments

  • Capture.JPG
    Capture.JPG
    80.7 KB · Views: 2

Jamesrob637

Established Member
Joined
12 Aug 2016
Messages
5,228
My observations agree with the graph. Cardiff Central and the square in front of it are deserted most of the time. Whereas there were queues at some bus stops yesterday. Cardiff Bus is still running a reduced trimetable which means hourly on various routes on Sundays. There's a steady stream of cars on all main roads.

As I mentioned in another thread, Belgian trains are still busy. We've really hammered public transport in the UK.

But I'm guessing even SNCB/NMBS are way down on pre-COVID levels too?

Belgian trains were notoriously busy pre-COVID (although they are generally long).
 

philosopher

Established Member
Joined
23 Sep 2015
Messages
1,349
But I'm guessing even SNCB/NMBS are way down on pre-COVID levels too?

Belgian trains were notoriously busy pre-COVID (although they are generally long).
Train travel is recovering a lot quicker this time, however it has clearly suffered way more than car travel. I suspect by the end of May car use may be very close to normal levels, however train use will still be less than 50% of normal.
 
Status
Not open for further replies.

Top