johnsmith147
Member
Hello all,
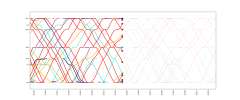
I thought I'd share a little project I've been working on over the last week or two -- a nice way to visualise live (or not live!) train positions along a given route. It uses RTT data and then does some reasonably fancy maths to predict current locations down to the second/make everything pretty.
Attached is a plot of Newcastle to York from earlier today -- you can plot much longer routes and they look very nice but alas railforums doesn't like big pictures! Any route which has a direct train along it it can be used, though if it's really long it becomes very slow to collect all the data. Other than just knowing what's about to go past, I find it's very useful to identify how the effects of disruption ripple around.
Link here: https://trainplots.streamlit.app/
Let me know what you think, or anything reasonably simple you'd like adding.
Thanks, and enjoy fiddling,
Oliver

 due to floating point inaccuracy.")