• Our booking engine at tickets.railforums.co.uk (powered by TrainSplit) helps support the running of the forum with every ticket purchase! Find out more and ask any questions/give us feedback in this thread!

ORR release quarterly passenger data

Krokodil

Established Member
Joined
23 Jan 2023
Messages
2,671
Location
Wales
I'm particularly surprised that Avanti grew so much as they are a Long Distance operator
From page 8:
Avanti West Coast and Transpennine Express ran reduced timetables in the previous year, which caused a large increase in passenger kilometres in the latest quarter, compared with the previous year (both up 39%).
 
Sponsor Post - registered members do not see these adverts; click here to register, or click here to log in
R

RailUK Forums

Nicholas Lewis

Established Member
Joined
9 Aug 2019
Messages
6,133
Location
Surrey
Latest data for last Quarter has been released.


All TOCs saw growth in passenger figures, with the Elizabeth Line (unsurprisingly) seeing the most growth at 40%, followed by Avanti at 38%, Scotrail at 34%, TPE at 33%, Lumo at 29%, Hull Trains at 27%, XC at 26%, EMR at 23%, GC at 22%, Cal Sleeper at 20%, LO at 20%, WMT (WMR and LNR) at 20%, TFW with 19%, Greater Anglia at 18%, Chiltern at 16%, SWR at 15%, Merseyrail at 15%, Northern at 14%, SE at 14%, GTR at 13%, GWR at 10%, LNER at 6%, C2C at 6% and Heathrow Express at 5%.

I'm particularly surprised that Avanti grew so much as they are a Long Distance operator, this indicates more growth in long distance leisure and business travel. HX growing also surprises me with EL coming online, but Heathrow as an airport saw an increase in passenger numbers so this means that more people are using both HX and EL.
Results are compared to previous 12mths on a qtr to qtr basis which is when Avanti were in a state of chaos with a vastly reduced timetable and probably same applies to TPE but the results are very good for other operators given the ongoing industrial action. However, Elizabeth line is such a big percentage of all trips it distorts meaningful comparisons with the past but you can look at individual operators in table 1223

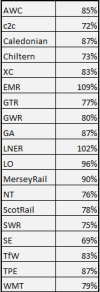
As they don't produce the table anymore by individual operator here is the main operators current position compared to Q4 2019

1711127486156.png

SE presumably impacted by Elizabeth Line and EMR was Connect service no doubt passenger abstraction from GTR.
 

J-2739

Established Member
Joined
30 Jul 2016
Messages
2,056
Location
Barnsley/Cambridge
Interesting to see that they have scaled back on the comparisons with pre-COVID figures; this seems to indicate that this is no longer a valuable metric of recovery, such has the time lapsed since it first hit our shores.
 

Snow1964

Established Member
Joined
7 Oct 2019
Messages
6,244
Location
West Wiltshire
When you start crunching the data in ORR tables 1223, 1233, 1243, 1253 you can see how things have changed

eg compared to 2019 (pre pandemic) get GWR at about 80% by passenger volume, but nearer 90% by passenger km (so travelling further). Get almost same number of train miles, but find vehicle km has fallen around 10%, as on average lost half a coach from every train.
 

Nicholas Lewis

Established Member
Joined
9 Aug 2019
Messages
6,133
Location
Surrey
When you start crunching the data in ORR tables 1223, 1233, 1243, 1253 you can see how things have changed

eg compared to 2019 (pre pandemic) get GWR at about 80% by passenger volume, but nearer 90% by passenger km (so travelling further). Get almost same number of train miles, but find vehicle km has fallen around 10%, as on average lost half a coach from every train.
Looking at train miles most operators have made reductions commensurate with reduced passengers yet GWR doesn't. Wonder why thats been allowed. Also GWR have the biggest draw on the public purse still albeit not when measured at subsidy per journey that is Northern.
 

Adrian1980uk

Member
Joined
24 May 2016
Messages
494
Results are compared to previous 12mths on a qtr to qtr basis which is when Avanti were in a state of chaos with a vastly reduced timetable and probably same applies to TPE but the results are very good for other operators given the ongoing industrial action. However, Elizabeth line is such a big percentage of all trips it distorts meaningful comparisons with the past but you can look at individual operators in table 1223

As they don't produce the table anymore by individual operator here is the main operators current position compared to Q4 2019

View attachment 154770

SE presumably impacted by Elizabeth Line and EMR was Connect service no doubt passenger abstraction from GTR.
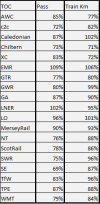
So take GA running 90% train miles compared with 87% passengers... Relationship anyone? Cause or effect is the question, maybe when I get a free moment I'll compare some of the others
 

Nicholas Lewis

Established Member
Joined
9 Aug 2019
Messages
6,133
Location
Surrey
So take GA running 90% train miles compared with 87% passengers... Relationship anyone? Cause or effect is the question, maybe when I get a free moment I'll compare some of the others
1711140687366.png

There you go all compared to Q4 2019. This would suggest GWR and SWR haven't cut back sufficiently compared to other operators.
 

stuu

Established Member
Joined
2 Sep 2011
Messages
2,769
View attachment 154788

There you go all compared to Q4 2019. This would suggest GWR and SWR haven't cut back sufficiently compared to other operators.
GWR are only running 91% of their vehicle KM, so if they are running similar train KM, the average train is shorter. Same with SWR, they are only running 86% of previous vehicle KM
 

Snow1964

Established Member
Joined
7 Oct 2019
Messages
6,244
Location
West Wiltshire
For clarity here are the percentages of vehicle km operated
Oct-Dec 2024 as percentage of Oct-Dec 2019
percentage in brackets is vs Oct-Dec 2010 (earliest quarterly figure)

Elizabeth line 341.6% (n/a)
Transpennine Express 113.6% (160.2%)
Heathrow Express 112.7% (696%)
Grand Central 106.6% (112.6%)
London Overground 106.5% (281.1%)
East Midlands 103.4% (103.4%)
Transport for Wales 101.8% (103.0%)
Hull Trains 100.5% (125.4%)
West Midlands 98.3% (139.4%)
Merseyrail 97.0% (100.6%)
Greater Anglia 95.3% (101.2%)
Caledonian Sleeper 94.9% (n/a)
Chiltern Railway 94.9% (147.3%)
Northern Rail 94.7% (137.2%)
Scotrail 92.9% (131.5%)
South Eastern 92.6% (111.3%)
Great Western Railway 91.6% (103.9%)
South Western Rail 90.6% (97.3%)
C2C 88.1% (102.2%)
LNER 82.5% (94.2%)
Avanti West Coast 80.8% (96.7%)
Govia Thameslink 80.3% (135.4%)
Cross Country 79.6% (82.4%)

I have ranked them compared to 5 years ago, some operators are operating more km than pre pandemic, but others have cut back, with cross country over 20% less

I have also added comparison (in brackets) to earliest quarterly figures (2010) which gives a movement over 14 years. Nearly all operators are higher, although most long distance operators (Avanti, LNER, Cross Country) have cut back. The only regional or commuter operator to have cut in 14 years is SWR

I cannot work out why there is such inconsistency in changes of service levels between operators (bar the obvious ones like Overground and Elizabeth lines), maybe others can explain better.
 

The exile

Established Member
Joined
31 Mar 2010
Messages
2,725
Location
Somerset
There you go all compared to Q4 2019. This would suggest GWR and SWR haven't cut back sufficiently compared to other operators.
Tell that to the long-suffering passengers on Portsmouth - Cardiff, for example.

Looking at train miles most operators have made reductions commensurate with reduced passengers yet GWR doesn't. Wonder why thats been allowed. Also GWR have the biggest draw on the public purse still albeit not when measured at subsidy per journey that is Northern.
Unless the figures are for after the December 2019, they won’t include some of GWR’s cuts (the Bristol superfasts that caught COVID before really getting off the ground). At the same time, the Metro West project has added quite a lot of extra train km around Bristol - but will still be in the ramping up stage of passenger numbers.
 
Last edited:

Benjwri

Established Member
Joined
16 Jan 2022
Messages
1,871
Location
Bath
View attachment 154788

There you go all compared to Q4 2019. This would suggest GWR and SWR haven't cut back sufficiently compared to other operators.
Although are you not comparing Passenger numbers to train km, and therefore this direct link from passenger numbers to vehicle km is not quite as you suggest. In GWRs case I would suggest this represents a shifting demographic from commuting to more long distance journeys being taken, which is not accounted for in your stats, which compare a distance adjusted figure to one that isn't. Certainly with GWR no longer operating the stoppers from Didcot to London that they did in 2019, this will represent a fairly significant cut on short distance, and obviously the shift to WFH since 2019 a dn increased leisure travel will result in longer journeys.
 

Nicholas Lewis

Established Member
Joined
9 Aug 2019
Messages
6,133
Location
Surrey
Although are you not comparing Passenger numbers to train km, and therefore this direct link from passenger numbers to vehicle km is not quite as you suggest. In GWRs case I would suggest this represents a shifting demographic from commuting to more long distance journeys being taken, which is not accounted for in your stats, which compare a distance adjusted figure to one that isn't. Certainly with GWR no longer operating the stoppers from Didcot to London that they did in 2019, this will represent a fairly significant cut on short distance, and obviously the shift to WFH since 2019 a dn increased leisure travel will result in longer journeys.
Sadly ORR only publish operator wide stats and i would imagine GWR have also lost a level of passengers on the Reading to Paddington corridor to Lizzie line as well.
 

Snow1964

Established Member
Joined
7 Oct 2019
Messages
6,244
Location
West Wiltshire
Although are you not comparing Passenger numbers to train km, and therefore this direct link from passenger numbers to vehicle km is not quite as you suggest. In GWRs case I would suggest this represents a shifting demographic from commuting to more long distance journeys being taken, which is not accounted for in your stats, which compare a distance adjusted figure to one that isn't. Certainly with GWR no longer operating the stoppers from Didcot to London that they did in 2019, this will represent a fairly significant cut on short distance, and obviously the shift to WFH since 2019 a dn increased leisure travel will result in longer journeys.
Yes GWR is nearer 80% by passenger volume, but 91.6% by passenger km, so on average each passenger is travelling about 12% further.

If you do GWR passenger km, vs vehicle km, then you find they are more crowded because vehicle km has been cut more than passenger km.

The passenger km vs vehicle km ratio is worse than when they had decided to add the 769s, (and before cutting the castle HSTs, and losing some 387s, and a DMU). Or to rephrase it there is stronger case now for urgent extra stock than when they were getting it 5 years ago.

In very blunt terms they have shortened each train by average half a coach, but due to longer journeys have more passengers per vehicle per km.
 

Top