• Our booking engine at tickets.railforums.co.uk (powered by TrainSplit) helps support the running of the forum with every ticket purchase! Find out more and ask any questions/give us feedback in this thread!

How are train diagrams produced?

Status
Not open for further replies.

Inversnecky

Member
Joined
1 Jan 2021
Messages
581
Location
Scotland
As a layperson looking in to the professional world of running railways, I've been intrigued by reference to diagrams, which I presume are timed movement lists for organising movements of locos/MUs for timetabling and knowing what's where when, yet I can't seem to find examples online. Can some kind soul please point me in the right direction? Thanks.
 
Sponsor Post - registered members do not see these adverts; click here to register, or click here to log in
R

RailUK Forums

StephenHunter

Established Member
Joined
22 Jul 2017
Messages
2,118
Location
London
They're generally not available online - they're worked out from Working Timetables and in-field observation.
 

John Webb

Established Member
Joined
5 Jun 2010
Messages
3,047
Location
St Albans
I think the term 'diagrams' comes from the one-time use of graph paper to sort out timetables - time along the base (X axis) and distance along the Y axis with the stations on a particular track at the appropriate locations. Lines are drawn at an angle at the average speed of the various types of train and what stations they stop at and for how long. If you do this for 24 hours it gives you the required detail to see what trains can be turned round to form the next service in the opposite direction. Hence the term 'diagram' for the movements of a particular unit or group of rolling stock.

But I suspect it is probably all done by computer these days!
 

30907

Veteran Member
Joined
30 Sep 2012
Messages
17,866
Location
Airedale
As a layperson looking in to the professional world of running railways, I've been intrigued by reference to diagrams, which I presume are timed movement lists for organising movements of locos/MUs for timetabling and knowing what's where when, yet I can't seem to find examples online. Can some kind soul please point me in the right direction? Thanks.
You could start with this (non-current!) thread:
https://www.railforums.co.uk/threads/frequently-requested-diagrams.170615/
I understand "diagram" as referring to what one loco/unit does on one day (or more); some of the entries on that thread do just that (give or take movements from/to depot eg #4), others list several sets in time order (eg #3).
I am not familiar with how different operators set out the information these days - but other members will be able to advise, and possibly point you in the direction of sources.
 

Peter C

Established Member
Joined
13 Oct 2018
Messages
4,514
Location
GWR land
Working Timetables can definitely be found online though, although often historical ones.
https://www.networkrail.co.uk/running-the-railway/the-timetable/working-timetable/ has the current and previous Working Timetables. You can download the whole thing for one WTT period by clicking on that WTT on the linked page, scrolling down to the bottom of the list, and then downloading the file there. If that makes sense!

I think the term 'diagrams' comes from the one-time use of graph paper to sort out timetables - time along the base (X axis) and distance along the Y axis with the stations on a particular track at the appropriate locations. Lines are drawn at an angle at the average speed of the various types of train and what stations they stop at and for how long. If you do this for 24 hours it gives you the required detail to see what trains can be turned round to form the next service in the opposite direction. Hence the term 'diagram' for the movements of a particular unit or group of rolling stock.

But I suspect it is probably all done by computer these days!
https://www.2d53.co.uk/graph/GRmenu.htm is almost always linked to when the discussion of timetable graphs comes up - and quite rightly too. It's a really good way of getting your head around how timetable graphs work, and allows you to manipulate what you can and can't see on each graph, thus allowing you to built up a better picture of what's going on.

As a layperson looking in to the professional world of running railways, I've been intrigued by reference to diagrams, which I presume are timed movement lists for organising movements of locos/MUs for timetabling and knowing what's where when, yet I can't seem to find examples online. Can some kind soul please point me in the right direction? Thanks.
I seem to remember making a thread asking a similar sort of question a while ago, but I can't find a link to it. These other links may be of some interest, though:

This one is more specific than this thread, as it's about the Cotswold Line, but there might be some information you could find useful (although I understand there's quite a bit in it).

https://partimespotter.wordpress.com/ is good for diagrams. If you hover over the "Diagrams" bit near the topic of the page, you'll see a drop-down list of diagrams available. They're not necessarily all 100% accurate all the time, but they're pretty good.

Essentially, from what I remember having asked a similar question on here before, a diagram is a collection of services on a particular day(s) which are to be worked by a form of train (either a loco-hauled set or a multiple unit).

I hope this is somewhat useful/understandable!

-Peter :)
 

JonathanH

Veteran Member
Joined
29 May 2011
Messages
18,531
As a layperson looking in to the professional world of running railways, I've been intrigued by reference to diagrams, which I presume are timed movement lists for organising movements of locos/MUs for timetabling and knowing what's where when, yet I can't seem to find examples online. Can some kind soul please point me in the right direction? Thanks.
There are some examples of Northern diagrams from October 2020 here


Freedom of Information Request ref FOI077

We write in connection with your request for information which was received by Northern Trains on
05/10/20:

“Is there any possibility to provide me the full diagrams for all northern services for October 2020?”

Under Section 1 (1)(a) of the FOI act we can confirm that we hold this information and we have attached
the diagrams requested separately.

We hope this information is of use to you.

Yours faithfully

Freedom of Information, Northern Trains Ltd
 

Watershed

Veteran Member
Associate Staff
Senior Fares Advisor
Joined
26 Sep 2020
Messages
11,945
Location
UK
As a layperson looking in to the professional world of running railways, I've been intrigued by reference to diagrams, which I presume are timed movement lists for organising movements of locos/MUs for timetabling and knowing what's where when, yet I can't seem to find examples online. Can some kind soul please point me in the right direction? Thanks.
When it comes to train (i.e. unit) diagrams, each diagram is given a depot code and number (e.g. NL101), and sets out a list of services to be operated on a given day, together with activities such as attaching, detaching, reversing, fuelling and shunting.

Where trains run coupled together, the diagram number of each train, together with its relative position, will be indicated.

If the train stays overnight somewhere that determines which diagram it will work the next day (i.e. because it's not at a depot or stabling point), it will show the next/previous day's diagram number. Mileages since last fuelling/tanking will be shown.

For any given fleet you would normally have the same number of diagrams as trains, with a certain percentage (typically 10-15%) shown as staying at a depot for maintenance, examinations or as spares.

Some TOCs, like Northern, have far more trains than they can accommodate in their depots. Equally, trains must visit the depot at regular intervals to be maintained in accordance with the maintenance schedule.

Therefore trains that don't start and finish at their home depot often form part of a cycle, typically several days long and with consecutive diagram numbers, to ensure this rotation of units. Other times there is no fixed rotation but rather it is down to Control on the day to allocate units to diagrams to ensure they end up at the depot when required.
 
Last edited:

306024

Established Member
Joined
23 Jan 2013
Messages
3,940
Location
East Anglia
Yes diagrams in UK railway language are the linking of schedules together to make up a plan of work. They can refer to both traction and crews. A locomotive or unit diagram will be the plan of work for a particular type of traction for a whole day, a crew diagram will be a plan of work for one individual (usually) for one shift.

Diagrams are absolutely integral to planning timetables. In fact sometimes outline traction diagrams will determine how the timetable is constructed, if you’ve only 10 trains to play with you can’t construct a timetable that requires 11. Normal practice for passenger operators is to compile a set of unit diagrams to resource the timetable with, then compile crew diagrams that cover every working in the unit diagrams.

Unit diagramming is quite mathematical, fuel range (where applicable) maintenance and fleet availability (how many trains you can plan to use each day from the total fleet) are all considerations. Ideally they should be done in parallel with the timetable construction. Network Rail require unit diagrams as part of a TOCs timetable bid.

Crew diagramming is a bit more subjective. Crew diagrams have to be made out to confirm with the agreements made between the company and the relevant union. These set out length of shift, duration of breaks and where they occur, walking times and various other allowances needed to operate the trains. Work can only be allocated to depots which hold the relevant route and traction knowledge. However within these parameters there are various ways crew diagrams can be constructed.

Computers are of course used in the construction of diagrams, and various software is available from different suppliers, some better than others. But you still need a skilled diagrammer to get the best out of those systems. A computer has no soul, and will construct crew diagrams to the rules it is given. Those rules sometimes need tweaking to moderate some of the stranger results a computer will generate that a human would not contemplate.

Finally the data can be presented in different ways. Linear graphs as shown in the Swiss example above is one way, and is now starting to appear in some UK planning offices. Traditionally they are more text driven as a list of workings.
 
Last edited:

CW2

Established Member
Joined
7 May 2020
Messages
1,922
Location
Crewe
The use of the word "Diagrams" is specific to the UK rail systems. If you try to obtain "Loco Diagrams" from Continental railways, you will probably end up with internal drawings or electrical circuit diagrams. The UIC in Paris employs a terminologist to overcome these issues, and also produce a handy railway dictionary.
Alas, it;s not a free service.
UIC Terminology Link.
 

Inversnecky

Member
Joined
1 Jan 2021
Messages
581
Location
Scotland
The use of the word "Diagrams" is specific to the UK rail systems. If you try to obtain "Loco Diagrams" from Continental railways, you will probably end up with internal drawings or electrical circuit diagrams.
When I searched ‘diagrams’ online, I did indeed get some interesting results of that type:


Thanks for all the responses: lots for me to get my teeth into!

https://www.networkrail.co.uk/running-the-railway/the-timetable/working-timetable/ has the current and previous Working Timetables. You can download the whole thing for one WTT period by clicking on that WTT on the linked page, scrolling down to the bottom of the list, and then downloading the file there. If that makes sense!


https://www.2d53.co.uk/graph/GRmenu.htm is almost always linked to when the discussion of timetable graphs comes up - and quite rightly too. It's a really good way of getting your head around how timetable graphs work, and allows you to manipulate what you can and can't see on each graph, thus allowing you to built up a better picture of what's going on.


I seem to remember making a thread asking a similar sort of question a while ago, but I can't find a link to it. These other links may be of some interest, though:

This one is more specific than this thread, as it's about the Cotswold Line, but there might be some information you could find useful (although I understand there's quite a bit in it).

https://partimespotter.wordpress.com/ is good for diagrams. If you hover over the "Diagrams" bit near the topic of the page, you'll see a drop-down list of diagrams available. They're not necessarily all 100% accurate all the time, but they're pretty good.

Essentially, from what I remember having asked a similar question on here before, a diagram is a collection of services on a particular day(s) which are to be worked by a form of train (either a loco-hauled set or a multiple unit).

I hope this is somewhat useful/understandable!

-Peter :)
Thank you, Peter. Just the ticket!
 
Last edited:

PHILIPE

Veteran Member
Joined
14 Nov 2011
Messages
13,472
Location
Caerphilly
Excellent reply and explanation @306024. I was, as a former diagrammer, thinking of replying myself but no need to now. What niggles me, I'm afraid, is people who refer to train services as diagrams so I hope this explains what a diagram actually is.
 

306024

Established Member
Joined
23 Jan 2013
Messages
3,940
Location
East Anglia
Thank you @PHILIPE. Glad I saved you some typing :)

What saddens me is that like so many skills, the computer is taking the enjoyment out of diagramming. Obviously a computer can generate lots of potential solutions in a fraction of the time a human takes to produce just one, and in most cases it will also be a more cost efficient solution which finance departments will love.

But it must not be forgotten that in the case of crew diagrams, someone has to get out of bed, often at what most of us would regard as an unsocial time, and perform those duties. A computer doesn't care about that.
 

FGW_DID

Established Member
Joined
23 Jun 2011
Messages
2,724
Location
81E
What niggles me, I'm afraid, is people who refer to train services as diagrams so I hope this explains what a diagram actually is.
I agree with that, one of my pet peeves! Great explanation by @306024.

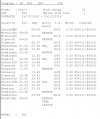
For the OP, as an example here is a traction diagram [GWR class 802 (5 car)] from 2018:
AE93522B-7649-470F-BB39-7C95C4FE5E56.jpeg

The diagram has the unit starting at Laira, it works three train services; 1A76, 1C81 & 1A35 before the unit ends it day at North Pole.
 

30907

Veteran Member
Joined
30 Sep 2012
Messages
17,866
Location
Airedale
The use of the word "Diagrams" is specific to the UK rail systems. If you try to obtain "Loco Diagrams" from Continental railways, you will probably end up with internal drawings or electrical circuit diagrams. The UIC in Paris employs a terminologist to overcome these issues, and also produce a handy railway dictionary.
Alas, it;s not a free service.
UIC Terminology Link.
The German for a loco diagram is accurately Umlaufplan - Running-about-plan - and ISTR was traditionally done in linear form. Not sure if crew plans use the same word, perhaps one of our German-speaking readers can answer?
Elsewhere I've seen the format station - train number - station - train number...
What niggles me, I'm afraid, is people who refer to train services as diagrams so I hope this explains what a diagram actually is.
I think it was Gerry Fiennes, when he was on the GE, who described his new interval timetable as a set of loco diagrams (don't have the exact words to hand) - but your point is fair.
 

Inversnecky

Member
Joined
1 Jan 2021
Messages
581
Location
Scotland
Excellent reply and explanation @306024. I was, as a former diagrammer, thinking of replying myself but no need to now. What niggles me, I'm afraid, is people who refer to train services as diagrams so I hope this explains what a diagram actually is.

That's what kind of confused me. I can understand the concept of plotting movements using x and y axes for time and distance to produce a graphic representation of train movements in order to facilitate planning, but it sort of threw me when people seemed to refer to timetabling as "diagrams", especially as it seemed unlikely at the time that they had any more proprietary imformation than a public timetable!
 

John Webb

Established Member
Joined
5 Jun 2010
Messages
3,047
Location
St Albans
That's what kind of confused me. I can understand the concept of plotting movements using x and y axes for time and distance to produce a graphic representation of train movements in order to facilitate planning, but it sort of threw me when people seemed to refer to timetabling as "diagrams", especially as it seemed unlikely at the time that they had any more proprietary imformation than a public timetable!
I have actually done this graphically for several preserved railway lines to understand better how they run their services, in particular if I've wanted to travel in a particular set of coaches specific to that line, or to be pulled by a particular loco. Makes an interesting exercise!
 

Class 170101

Established Member
Joined
1 Mar 2014
Messages
7,908
Thank you @PHILIPE. Glad I saved you some typing :)

What saddens me is that like so many skills, the computer is taking the enjoyment out of diagramming. Obviously a computer can generate lots of potential solutions in a fraction of the time a human takes to produce just one, and in most cases it will also be a more cost efficient solution which finance departments will love.

But it must not be forgotten that in the case of crew diagrams, someone has to get out of bed, often at what most of us would regard as an unsocial time, and perform those duties. A computer doesn't care about that.

Indeed ASLEF threw the diagrams out at one TOC I've heard about because they knew they had been produced by computer software rather than skilled diagrammers. The skilled diagrammers actually did better than the computer, second time around.
 

306024

Established Member
Joined
23 Jan 2013
Messages
3,940
Location
East Anglia
Depends what you mean by ‘did better’. Other things being equal, the best a human can hope to do is equal the computer output for producing cost effective / efficient diagrams. If the computer can’t match that then the parameters programmed into the computer must be suspect in the first place, or the software isn’t up to the job.

The software provided by the leading suppliers does produce mathematically correct diagrams, just how palatable they are will depend on the rules they are programmed to work to.
 

Whisky Papa

Member
Joined
8 Aug 2019
Messages
385
I think it was Gerry Fiennes, when he was on the GE, who described his new interval timetable as a set of loco diagrams (don't have the exact words to hand) - but your point is fair.
Yes, I recall reading that section in his book I Tried to Run a Railway, his comment was along the lines of working out how quickly a Britannia could cover the required mileage, and be turned, coaled and watered at each end to give a minimum round-trip. Hang a rake of coaches on the back and there's your timetable. As I'd worked in bus scheduling prior to reading this, I was a little surprised that working out a round-trip time seemed a radical approach!

One thing I've not seen mentioned in the excellent posts so far - the unit/loco diagrams don't appear on the working timetables, even though the information is provided to Network Rail. Again, this came as a surprise when moving to train planning, but the explanation is quite simple - they are potentially subject to frequent alteration for Short Term Planning purposes, usually planned engineering works. It is quite possible that a line closure affecting ECS moves late at night or early in the morning will result in different unit diagram numbers running through the day. This also means the crew diagrams will need to be adapted to show the new unit diagram numbers, certainly in the TOC I worked for.
 

whoosh

Established Member
Joined
3 Sep 2008
Messages
1,361
Indeed ASLEF threw the diagrams out at one TOC I've heard about because they knew they had been produced by computer software rather than skilled diagrammers. The skilled diagrammers actually did better than the computer, second time around.

It's quite common for 'version 1' of a set of traincrew diagrams to be tweaked into a version 2 or even 3 with suggestions, disagreements, and requests made from the staff's union reps. This can sometimes involve swapping of certain trains between diagrams of different depots to give less ardous duties or more varied traction/route knowledge.
 

Wilts Wanderer

Established Member
Joined
21 Nov 2016
Messages
2,462
Quite often the issue with automated crew diagramming is that the parameters coded in are all minimum planning values. So the minimum time taken to walk from A to B, the minimum rest break times, etc. These are agreed between TOC and Union but normally the expectation is that they won’t be used for every instance all day, as that leaves little margin for error. This is the sort of ‘human touch’ that is needed to make a set of workings palatable to the workforce reps etc. Building some slack in is also required so as to make room for accommodated turns, domestic arrangements etc which could never be coded into diagramming software as it involved personal circumstances etc.
 

XAM2175

Established Member
Joined
8 Jun 2016
Messages
3,469
Location
Glasgow
I think the term 'diagrams' comes from the one-time use of graph paper to sort out timetables - time along the base (X axis) and distance along the Y axis with the stations on a particular track at the appropriate locations. ...

But I suspect it is probably all done by computer these days!
As a real-world example of modern computerised timetable graphing, Queensland Rail in Australia openly publish what they refer to as "Master Train Plans" for their regional network:
 

IanXC

Emeritus Moderator
Joined
18 Dec 2009
Messages
6,331
I agree with that, one of my pet peeves! Great explanation by @306024.

For the OP, as an example here is a traction diagram [GWR class 802 (5 car)] from 2018:
View attachment 91137

The diagram has the unit starting at Laira, it works three train services; 1A76, 1C81 & 1A35 before the unit ends it day at North Pole.

What are activities "Nby" and "Box" in this diagram?
 

IanXC

Emeritus Moderator
Joined
18 Dec 2009
Messages
6,331
That is correct. A clue at the head of the column which says Route and can be used to identify the route if there are alternatives available.

Silly me, serves me right for not reading the whole thing! The only diagrams I've seen before insert the via points into the Location column, leaving anything in this column purely as activities, clearly it can be done differently! Thanks all!
 
Status
Not open for further replies.

Top