And the sheer number of billionaires with Space Programmes too!However, we're what, ten billion and counting? Which means that many in the global South live lives that aren't massively better than they were a century ago, despite consuming more resources, just through sheer numbers of mouths to feed.
-
Our new ticketing site is now live! Using either this or the original site (both powered by TrainSplit) helps support the running of the forum with every ticket purchase! Find out more and ask any questions/give us feedback in this thread!
You are using an out of date browser. It may not display this or other websites correctly.
You should upgrade or use an alternative browser.
You should upgrade or use an alternative browser.
A discussion about falling birth rates in various parts of the world
- Thread starter DustyBin
- Start date
- Status
- Not open for further replies.
Sponsor Post - registered members do not see these adverts; click here to register, or click here to log in
R
RailUK Forums
87electric
Member
- Joined
- 27 Jan 2010
- Messages
- 1,169
But Carbon Dioxide is the gas of life. Without it, we die. You can't just demonize Carbon as a complete monster.Agreed.
There's far too many people on the planet as it is.
...and one factor in CO2 output that I never see mentioned anywhere is how much CO2 people breathe out; it may not sound much at a bit over 1kg per person per day, but when you consider how quickly we have been adding every extra billion people in the last 40 =- 50 years... well, I will let you do the maths...
From the NASA website, article from 2016. More greening of land on the earth in the last 35 years because of carbon.
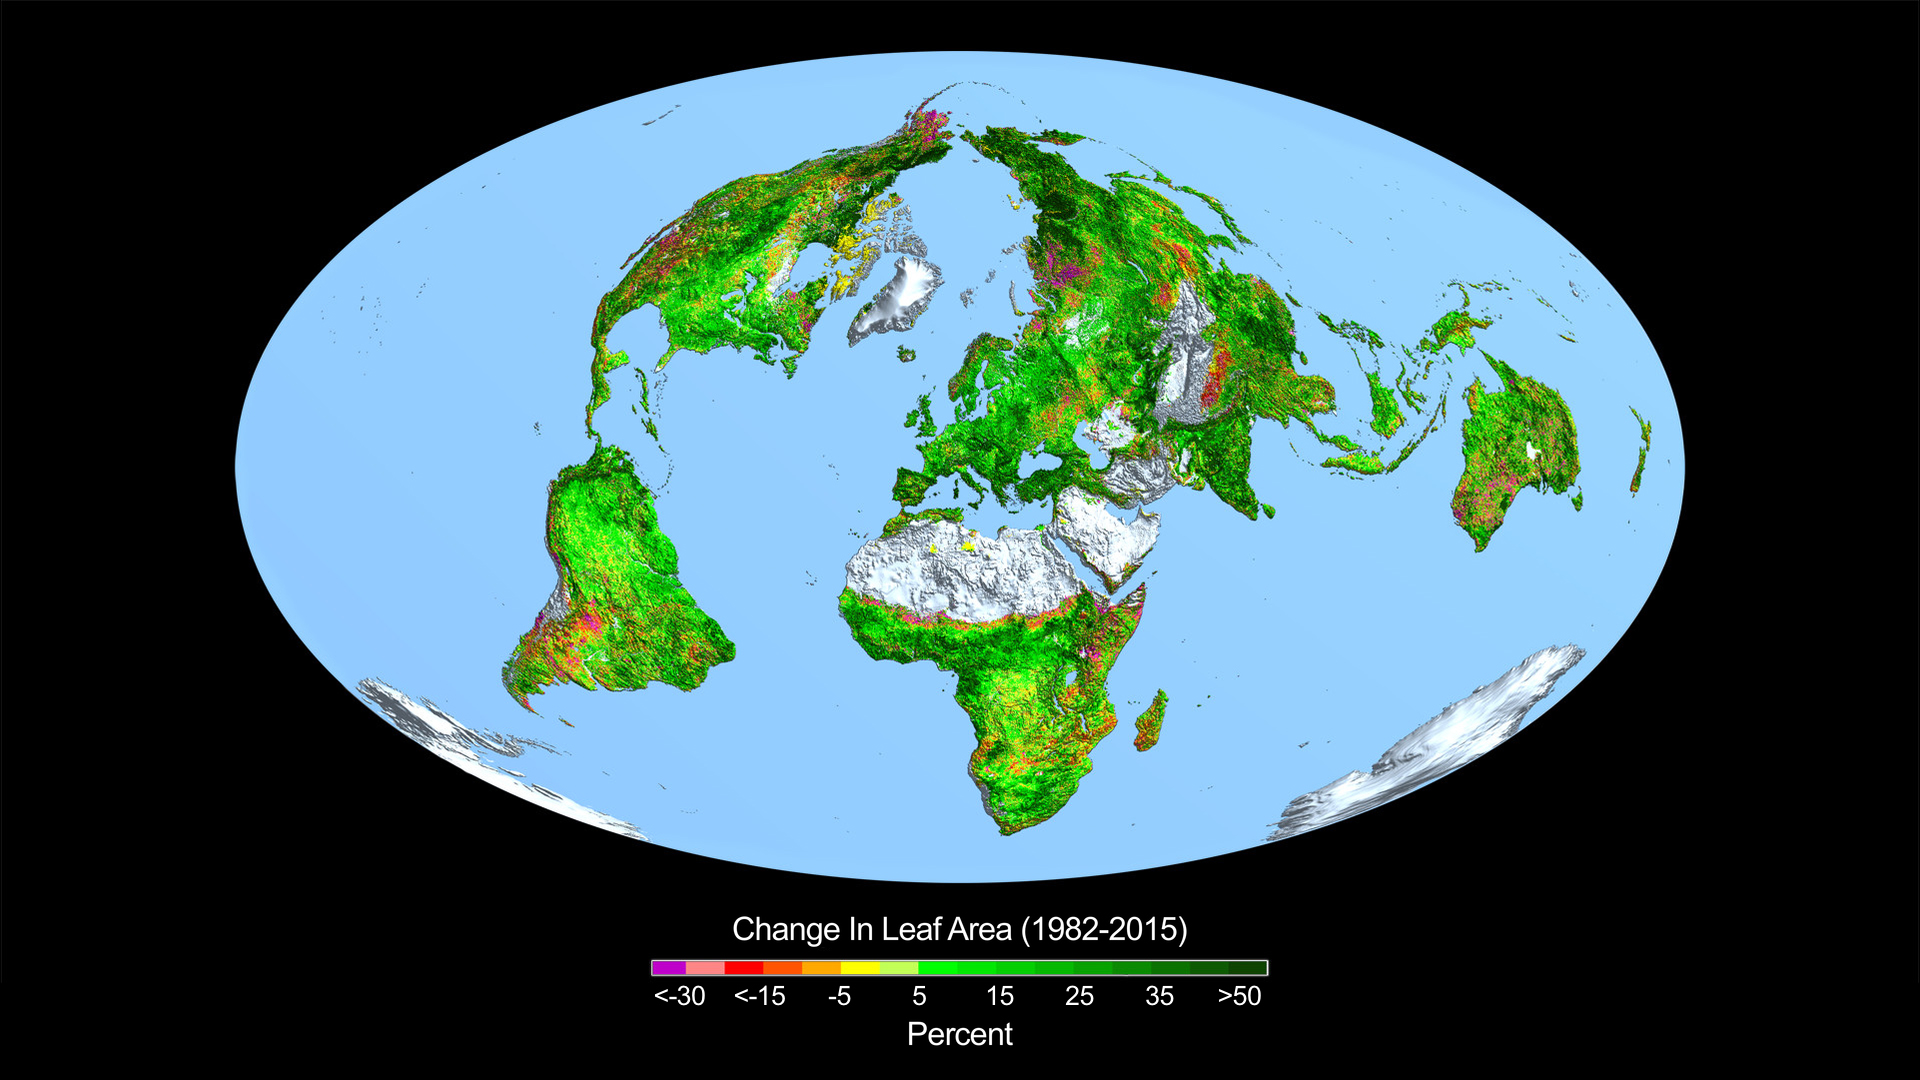
Carbon Dioxide Fertilization Greening Earth, Study Finds - NASA
From a quarter to half of Earth’s vegetated lands has shown significant greening over the last 35 years largely due to rising levels of atmospheric carbon
 www.nasa.gov
I'm aware of the complexities of the situation. Just add this to the mix when thinking about ALL of the problems.
HSTEd
Veteran Member
- Joined
- 14 Jul 2011
- Messages
- 18,808
This won't become a problem whilst the primary source of food calories is photogenic.Agreed.
There's far too many people on the planet as it is.
...and one factor in CO2 output that I never see mentioned anywhere is how much CO2 people breathe out; it may not sound much at a bit over 1kg per person per day, but when you consider how quickly we have been adding every extra billion people in the last 40 =- 50 years... well, I will let you do the maths...
Because that carbon just came from atmospheric carbon dioxide over the past couple of years!
Population growth is going to go steeply negative within the next century the way things are going.
Our problem is going to be huge numbers of elderly people consuming resources and not enough workers to do the jobs that need doing.
In the UK as well as globally - and in the UK context immigration will not be available as an easy fix for politicians for much longer, there won't be enough immigrants to go around.
A pessimistic look at the current stats suggests a human extinction sometime around 2250, even without any disasters.
eyebrook1961
Member
We've got five adults (term used very loosely . . .) 20 y.o. to 30 y.o. but can't get rid of any of them, should have put them on ebay when they were younger . . . (or bought a television!)We’ve got adults.")
I've been promoted though, from "Dad's taxi" to "Dad's removals" for daughter (#5) going from uni room to a shared house, and then for moving son (#4) to uni (he's somehow managed to get the same room in the same uni accommodation block for every year he's been there). The plus side is that we get to visit york regularly and also middlesbrough (great place for eating out)
Back (roughly) to topic, i think that, because there's five of them, they've probably been put off having any offspring of their own . . .
What reason do you have to believe that we won't just reach an equilibrium around a smaller population than we currently have?A pessimistic look at the current stats suggests a human extinction sometime around 2250, even without any disasters.
HSTEd
Veteran Member
- Joined
- 14 Jul 2011
- Messages
- 18,808
In order to have an equilibrium total fertility rate has to be around 2.1What reason do you have to believe that we won't just reach an equilibrium around a smaller population than we currently have?
In much of the world the fertility rate is already below this level, and almost everywhere else the fertility rate is falling quite rapidly.
If the fertility rate does not recover, and only Kazakhstan has managed any meaningful recovery in fertility rates, there can be no equilibrium.
It will a spiral to zero population.
EDIT:
The global overall total fertility rate had already fallen to 2.3 by 2023, it was 2.57 in 2013 and 2.66 in 2003.
And what reason do you have to believe that it won't rise again as pressures on resources and people's lives decrease? One of the main drivers of lower fertility rates in western societies is that people say that they can't afford to have kids due to housing and other financial strains.In order to have an equilibrium total fertility rate has to be around 2.1
In much of the world the fertility rate is already below this level, and almost everywhere else the fertility rate is falling quite rapidly.
azt
Member
This is really interesting stuff. Do you have any references for these figures?In order to have an equilibrium total fertility rate has to be around 2.1
In much of the world the fertility rate is already below this level, and almost everywhere else the fertility rate is falling quite rapidly.
If the fertility rate does not recover, and only Kazakhstan has managed any meaningful recovery in fertility rates, there can be no equilibrium.
It will a spiral to zero population.
EDIT:
The global overall total fertility rate had already fallen to 2.3 by 2023, it was 2.57 in 2013 and 2.66 in 2003.
HSTEd
Veteran Member
- Joined
- 14 Jul 2011
- Messages
- 18,808
Pressures on resources and lives won't decrease that much, because there will be the burden of supporting an enormous population of elderly people who are economically unproductive.And what reason do you have to believe that it won't rise again as pressures on resources and people's lives decrease? One of the main drivers of lower fertility rates in western societies is that people say that they can't afford to have kids due to housing and other financial strains.
What you save in housing will go in state pension and healthcare for the elderly.
You might not even save that much in housing because a lot of housing stock will be in locations which are extremely economically unattractive once the population starts falling off - which in any case will be long after the birthrate has collapsed.
== Doublepost prevention - post automatically merged: ==
This study by the Lancet is illustrative.This is really interesting stuff. Do you have any references for these figures?
Realistically though it isn't going to be that enormous of a population of old people. The main reason that we're seeing it now is because of the impact of early 20th century improvements in healthcare meant that average life expectancy suddenly jumped by twenty or thirty years, we haven't seen anything like that big of a jump in the last forty or fifty years. People born today are going to live and be productive just about as long as people born 50 years ago.Pressures on resources and lives won't decrease that much, because there will be the burden of supporting an enormous population of elderly people who are economically unproductive.
azt
Member
Thanks for the referencePressures on resources and lives won't decrease that much, because there will be the burden of supporting an enormous population of elderly people who are economically unproductive.
What you save in housing will go in state pension and healthcare for the elderly.
You might not even save that much in housing because a lot of housing stock will be in locations which are extremely economically unattractive once the population starts falling off - which in any case will be long after the birthrate has collapsed.
== Doublepost prevention - post automatically merged: ==
This study by the Lancet is illustrative.
")
HSTEd
Veteran Member
- Joined
- 14 Jul 2011
- Messages
- 18,808
By 2123 the ONS central projection is that 31% of the population will be over 65, compared to 19% to do.Realistically though it isn't going to be that enormous of a population of old people. The main reason that we're seeing it now is because of the impact of early 20th century improvements in healthcare meant that average life expectancy suddenly jumped by twenty or thirty years, we haven't seen anything like that big of a jump in the last forty or fifty years. People born today are going to live and be productive just about as long as people born 50 years ago.
44% of the population will either be 14 or younger or 65 or older, up from ~35.6% today.
We are looking at rapidly moving to the point where every working age person is supporting one dependent, and yes I know 65 is not the retirement age but the data is in five year chunks.
It's also worth noting that the situation deteriorates pretty much every time the ONS revises its projection (2020 was a weird outlier in total population because it made wildly different immigration assumptions), because it consistently overestimates birth rate (which keeps falling faster than anticipated).
The political impacts of such an enormous voting block is likely to make things worse, beyond this
Last edited:
But again, that is based on the assumption that birth rates won't increase. I fully expect that they will.By 2123 the ONS central projection is that 31% of the population will be over 65, compared to 19% to do.
44% of the population will either be 14 or younger or 65 or older, up from ~35.6% today.
DynamicSpirit
Established Member
By 2123 the ONS central projection is that 31% of the population will be over 65, compared to 19% to do.
44% of the population will either be 14 or younger or 65 or older, up from ~35.6% today.
I don't believe it's possible to accurately make a projection of that nature 100 years into the future. We're talking, predicting the demographics of people, almost none of whom are likely to have yet been born.
== Doublepost prevention - post automatically merged: ==
But again, that is based on the assumption that birth rates won't increase. I fully expect that they will.
I agree - for the simple reason that, if population decline becomes a serious issue, then there will be huge political pressure to get birth rates back up again. Right now, our main problem is that the population is growing too fast, and there's therefore little reason to encourage people to have more children. But if, hypothetically in the future, we end up in a situation where population decline starts threatening economies (or, worse, the future of humanity), then Governments will become hugely motivated to find ways to get birth rates back up again. I think we can be fairly confident that would result in changes in both society and in the economy/tax/welfare benefits etc. to get people to have more children. The same public-spirited people who today decline to have children for the sake of the future of humanity would in that scenario likely be deliberately having children for the sake of the future of humanity.
In short, humanity is not going to let itself die out over some generations for lack of children, because most people do actually care at least somewhat about the future of humanity, and would therefore be likely to adjust their lifestyles to avoid that happening.
Last edited:
HSTEd
Veteran Member
- Joined
- 14 Jul 2011
- Messages
- 18,808
I agree - for the simple reason that, if population decline becomes a serious issue, then there will be huge political pressure to get birth rates back up again. Right now, our main problem is that the population is growing too fast, and there's therefore little reason to encourage people to have more children. But if, hypothetically in the future, we end up in a situation where population decline starts threatening economies (or, worse, the future of humanity), then Governments will become hugely motivated to find ways to get birth rates back up again.
We are almost certainly at that point already.
And yet people still believe that not having children is a net benefit to society - when it is not.
The popular discourse and social expectations have been set and will be very difficult to reverse.
The problem is that in countries with major population collapse issues, this is not happening.In short, humanity is not going to let itself die out over some generations for lack of children, because most people do actually care at least somewhat about the future of humanity, and would therefore be likely to adjust their lifestyles to avoid that happening.
As an example, South Korea's total fertility rate has fallen to 0.55 and is still dropping.
People might care about the future of humanity in the abstract, but it appears they are unlikely to make major lifestyle changes on that basis.
Pro natalist policies have been shown to be largely ineffective pretty much everywhere they have been tried.
The United Nations published World Population Prospects earlier this month.
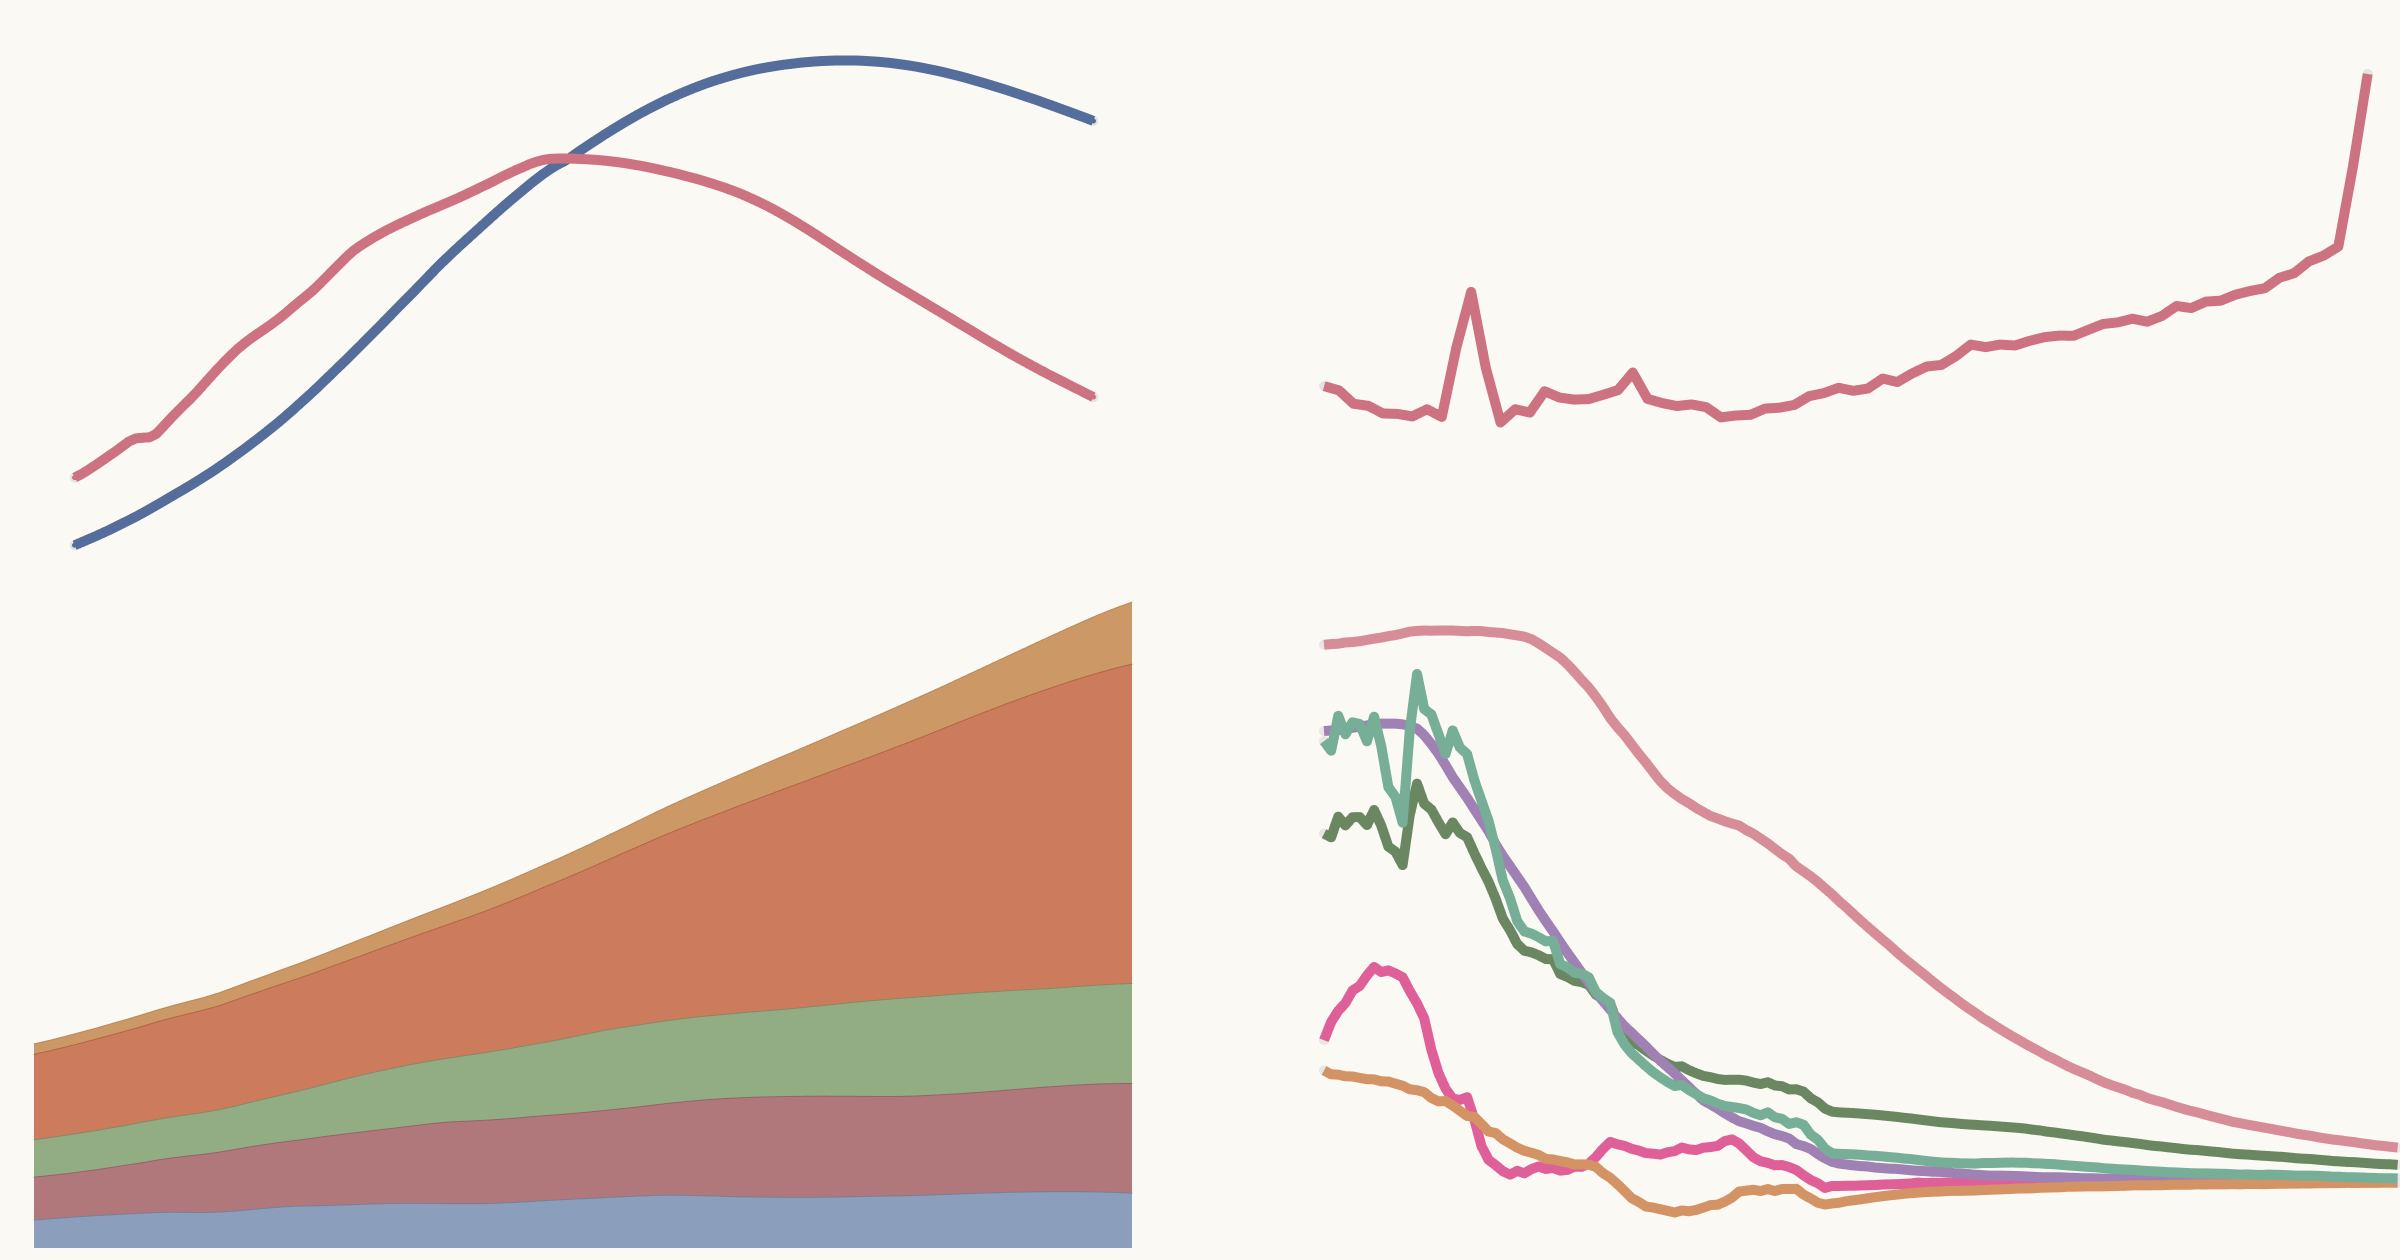
 ourworldindata.org
I haven't worked out how to reproduce the graphs here, but they are worth looking at by following the link.
Peak global population and other key findings from the 2024 UN World Population Prospects
Falling fertility rates, migration movements, and China’s population decline.
Peak global population and other key findings from the 2024 UN World Population Prospects
Falling fertility rates, migration movements, and China’s population decline.
The United Nations doesn’t only publish historical estimates of how population and demographic trends have changed in the past; it also makes projections for what the future might look like. To be clear, these are projections, not predictions of changes in the future.
In its 2022 publication, the UN estimated that, in its medium scenario, the global population would peak in 2086 at around 10.4 billion people.
This year’s edition brings this peak forward slightly to 2084, with the population topping at just under 10.3 billion.
The chart below compares the two revisions.
This isn’t the first time the projected peak has been pulled earlier. According to its 2019 edition, the global population would reach 10.9 billion by 2100 and keep growing. The 2022 revision was the first to project a peak in the 21st century.
I haven't worked out how to reproduce the graphs here, but they are worth looking at by following the link.
It is already happening in many Asian and European countries, including China and Russia.if, hypothetically in the future, we end up in a situation where population decline starts threatening economies
In its 2022 revision, the UN projected that India would overtake China to become the world’s most populous country in 2023.
Its new estimates confirm this. You can see this crossover in the chart below.
The UN also expects that China’s population has peaked and is declining. This is because of a rapid drop in China’s fertility rates, which have been below the “replacement rate” — the average number of children per woman needed to keep the population constant from one generation to the next — for a long time.
Governments will become hugely motivated to find ways to get birth rates back up again.
South Korea is probably the country most deeply into this hole. Other countries should be looking and learning.The problem is that in countries with major population collapse issues, this is not happening.
As an example, South Korea's total fertility rate has fallen to 0.55 and is still dropping.
How very true.Real terms wage cuts and the massive growth in housing cost have done for birthrates certainly in the UK and most of western Europe.
Long gone are the days where you could buy a house for the cost of a packet of Quavers and run it on the single income of somebody working in a shop or factory.
How can people expected to be having children when houses cost a massive slice of a dual income couples wages?
Just shows you want kind of a fix we are in at the moment and no signs of things changing, and unlikely to change for a long time.
railfan99
Established Member
Ideally, we need to be aspiring to maintain a sustainable population level in the long term, with no major peaks and troughs. The baby boom is the elephant in the room as to sustain that generation, you need each of the next generations to be bigger than the previous. If our planet could somehow expand in physical size, this would be okay, but it can't and thus we are limited in habitable land and resources which will eventually run out.
The world produces sufficient food to feed 10 billion people, although food waste and lack of refrigeration are among the problems to be solved.
kristiang85
Established Member
- Joined
- 23 Jan 2018
- Messages
- 2,712
South Korea is probably the country most deeply into this hole. Other countries should be looking and learning.
I saw this video a few weeks back, which (ignoring the alarmist title) is quite a fascinating insight into South Korea's demographic problem.
railfan99
Established Member
Japan isn't much better: its population is declining year-on-year.
Watching the video posted above, it appears that the ideal scenario is to have more working age people than children and retirees combined.What's the reasoning behind that? That doesn't seem at all obvious to me?
I would expect that the issue is, whether standard living that we collectively decide as a nation we want to have can be sustained from the wealth generated by the proportion of the population who are actually working. Provided that's the case, then in order to keep that income long term, you simply need each generation to be the same size as the previous generation. If the proportion of the population working isn't sufficient to do that, then you have a problem - but one whose answer probably lies in economics rather than population size.
So let’s say in this hypothetical example that there is a society with exactly 10 citizens for each age, and everyone lives to their 100th birthday:
Age 90-100, retired (100 citizens)
Age 80-90, retired (100 citizens)
Age 70-80, retired (100 citizens)
Age 65-70, retired (50 citizens)
Age 60-65, working (50 citizens)
Age 50-60, working (100 citizens)
Age 40-50, working (100 citizens)
Age 30-40, working (100 citizens)
Age 20-30, working (100 citizens)
Age 15-20, working (50 citizens)
Age 10-15, not working (50 citizens)
Age 0-10, not working (100 citizens)
That gives a total of 1000 total citizens, of which there is a 50/50 split between economically active and inactive people. To increase the ratio to favour working people, you either need to increase the retirement age, reduce the age in which young people start working or reduce the age of death.
Or you could change the above table so that there are more citizens in economically active groups, but this is where it starts to get tricky:
Age 90-100, retired (50 citizens)
Age 80-90, retired (50 citizens)
Age 70-80, retired (100 citizens)
Age 65-70, retired (100 citizens)
Age 60-65, working (100 citizens)
Age 50-60, working (200 citizens)
Age 40-50, working (200 citizens)
Age 30-40, working (200 citizens)
Age 20-30, working (200 citizens)
Age 15-20, working (100 citizens)
Age 10-15, not working (100 citizens)
Age 0-10, not working (100 citizens)
With a total population now of 1500, you have nearly two thirds of working age, but the elephant in the room is the low number of children in proportion of working adults, assuming that these will become part of the future workforce.
You’ll also have to assume that for every citizen that dies, another one is born to keep the population at exactly the same level. Going by the second table, if everyone in the 30-40 age bracket had one child, the next two generations would consist of 200 citizens, but the two generations after that would only produce 100. Fast forward 40 years and the population will look something like this:
Age 90-100, retired (200 citizens)
Age 80-90, retired (200 citizens)
Age 70-80, retired (200 citizens)
Age 65-70, retired (100 citizens)
Age 60-65, working (100 citizens)
Age 50-60, working (200 citizens)
Age 40-50, working (100 citizens)
Age 30-40, working (200 citizens)
Age 20-30, working (200 citizens)
Age 15-20, working (100 citizens)
Age 10-15, not working (100 citizens)
Age 0-10, not working (100 citizens)
This creates a significantly larger elderly population, giving an even 50/50 split between economically active and inactive people. While that may not be alarming, it does show the importance of maintaining a stable birth rate without allowing it to spiral out of control.
This is already happening. And to be honest a lot of people are hitting 65-ish and finding that they are still able and willing to work.To increase the ratio to favour working people, you either need to increase the retirement age, reduce the age in which young people start working or reduce the age of death.
Snow1964
Established Member
BBC Radio (or BBC sounds) Rhysearch (6:30 today) has a witty summary of this subject
I've said this in another thread but what you don't want to be doing is encouraging people to have children who do not want to.
Bringing up children requires huge amounts of personal responsibility and should not be undertaken by those who are less than keen. Otherwise, the child will basically be brought up unloved, and that's no good to anyone.
So (as a childless person who is almost certain to remain that way) I would very strongly argue against any "push" for the childless by choice to have children they do not especially want.
I don't think that anyone is advocating for Ceaușescu-esque policies. What is being suggested is making it easier for those who do want to have children to do so.I've said this in another thread but what you don't want to be doing is encouraging people to have children who do not want to.
Bringing up children requires huge amounts of personal responsibility and should not be undertaken by those who are less than keen. Otherwise, the child will basically be brought up unloved, and that's no good to anyone.
So (as a childless person who is almost certain to remain that way) I would very strongly argue against any "push" for the childless by choice to have children they do not especially want.
- Status
- Not open for further replies.