• Our booking engine at tickets.railforums.co.uk (powered by TrainSplit) helps support the running of the forum with every ticket purchase! Find out more and ask any questions/give us feedback in this thread!

ORR Origin-Destination Matrix 2022-23

Gaelan

Member
Joined
3 Apr 2023
Messages
809
Location
St Andrews
Last year, for the first time, the ORR published the Origin-Destination Matrix - a dataset consisting of an estimate, from ticketing data, of the number of journeys between every pair of stations. They've just now released the 2022-23 data. As the process of making an account to download it is something of a pain, I've re-uploaded it here:


Note that this file is about 140MB uncompressed. I've sorted it by number of journeys, to avoid issues with Excel deleting rows past around a million - it'll still happen, but the journeys that get lost will be rare ones. Also, I'm legally required to tell you that it Contains public sector information licensed under the Open Government Licence v3.0.

The top journeys were:
1. London Liverpool Street - Tottenham Court Road (2896936)
2. Stratford (London) - London Liverpool Street (2715657)
3. London Liverpool Street - Stansted Airport (2529592)
4. Barking - West Ham (2448000)
5. London Victoria - Gatwick Airport (2292005)
6. Tottenham Court Road - London Paddington (2197641)
7. Reading - London Paddington (2045987)
8. Tottenham Court Road - Bond Street (1964482)
9. London Paddington - Bond Street (1860320)
10. Stratford (London) - Romford (1816911)

This data is estimated from ticketing numbers, so in some cases it'll be wrong. This is especially apparent for stations ticketed as groups (Glasgow Central/Queen Street, London Terminals, etc), where they use various rules to estimate which station was likely used in practice. They've improved the methodology for London Terminals this year (so there's no longer the strange situation where most Sheffield passengers went to Kings Cross), but other anomalies are likely to remain. If allocation between group stations looks wrong, it probably is. Similarly, things like PTE day/concessionary tickets and incomplete contactless journeys will affect the accuracy of the data to some degree, with the latter manifesting as journeys from a station back to the same station.
 
Last edited:
Sponsor Post - registered members do not see these adverts; click here to register, or click here to log in
R

RailUK Forums

hwl

Established Member
Joined
5 Feb 2012
Messages
7,401
Last year, for the first time, the ORR published the Origin-Destination Matrix - a dataset consisting of an estimate, from ticketing data, of the number of journeys between every pair of stations. They've just now released the 2022-23 data. As the process of making an account to download it is something of a pain, I've re-uploaded it here:


Note that this file is about 140MB uncompressed. I've sorted it by number of journeys, to avoid issues with Excel deleting rows past around a million - it'll still happen, but the journeys that get lost will be rare ones. Also, I'm legally requited to tell you that it Contains public sector information licensed under the Open Government Licence v3.0.

The top journeys were:
1. London Liverpool Street - Tottenham Court Road (2896936)
2. Stratford (London) - London Liverpool Street (2715657)
3. London Liverpool Street - Stansted Airport (2529592)
4. Barking - West Ham (2448000)
5. London Victoria - Gatwick Airport (2292005)
6. Tottenham Court Road - London Paddington (2197641)
7. Reading - London Paddington (2045987)
8. Tottenham Court Road - Bond Street (1964482)
9. London Paddington - Bond Street (1860320)
10. Stratford (London) - Romford (1816911)

This data is estimated from ticketing numbers, so in some cases it'll be wrong. This is especially apparent for stations ticketed as groups (Glasgow Central/Queen Street, London Terminals, etc), where they use various rules to estimate which station was likely used in practice. They've improved the methodology for London Terminals this year (so there's no longer the strange situation where most Sheffield passengers went to Kings Cross), but other anomalies are likely to remain. If allocation between group stations looks wrong, it probably is. Similarly, things like PTE day/concessionary tickets and incomplete contactless journeys will affect the accuracy of the data to some degree, with the latter manifesting as journeys from a station back to the same station.
So we now have 5 years including one full pre-covid year as a baseline.

It is worth noting that publication coincided with the publication of the annual regional stats which are effectively a metanalysis of the ODM data and future years ODM publication is likely to align with Regional data publication.


HSTEd

Veteran Member
Joined
14 Jul 2011
Messages
16,745
So of the top ten journeys, four are only possible by Crossrail and three are partially via Crossrail (although I imagine Reading-London will only be a small share for Crossrail).

The only ones I can tell are not associated with crossrail are 3, 4 and 5.

That's quite a skew!
 

JW4

Member
Joined
14 Feb 2023
Messages
272
Location
Birmingham
Last year, for the first time, the ORR published the Origin-Destination Matrix - a dataset consisting of an estimate, from ticketing data, of the number of journeys between every pair of stations. They've just now released the 2022-23 data. As the process of making an account to download it is something of a pain, I've re-uploaded it here:


Note that this file is about 140MB uncompressed. I've sorted it by number of journeys, to avoid issues with Excel deleting rows past around a million - it'll still happen, but the journeys that get lost will be rare ones. Also, I'm legally requited to tell you that it Contains public sector information licensed under the Open Government Licence v3.0.

The top journeys were:
1. London Liverpool Street - Tottenham Court Road (2896936)
2. Stratford (London) - London Liverpool Street (2715657)
3. London Liverpool Street - Stansted Airport (2529592)
4. Barking - West Ham (2448000)
5. London Victoria - Gatwick Airport (2292005)
6. Tottenham Court Road - London Paddington (2197641)
7. Reading - London Paddington (2045987)
8. Tottenham Court Road - Bond Street (1964482)
9. London Paddington - Bond Street (1860320)
10. Stratford (London) - Romford (1816911)

This data is estimated from ticketing numbers, so in some cases it'll be wrong. This is especially apparent for stations ticketed as groups (Glasgow Central/Queen Street, London Terminals, etc), where they use various rules to estimate which station was likely used in practice. They've improved the methodology for London Terminals this year (so there's no longer the strange situation where most Sheffield passengers went to Kings Cross), but other anomalies are likely to remain. If allocation between group stations looks wrong, it probably is. Similarly, things like PTE day/concessionary tickets and incomplete contactless journeys will affect the accuracy of the data to some degree, with the latter manifesting as journeys from a station back to the same station.
What’s Shrewsbury to London Euston out of curiosity?
 

deltic

Established Member
Joined
8 Feb 2010
Messages
3,225
@Gaelan thanks for this - that's my weekend sorted!

What’s Shrewsbury to London Euston out of curiosity?
Shrewsbury to London Euston was 52k
Shrewsbury to London BR was 56k
While Shropshire to London was 86k
 
Last edited:

JW4

Member
Joined
14 Feb 2023
Messages
272
Location
Birmingham
Thanks for the download again Gaelan.

Sheffield 2021/22 v 2022/23
St Pancras - 29,358 —> 341,889
Kings Cross - 188,481 —> 70,110
Euston - 13,861 —> 3,404
There’s the methodology change in action
 
Last edited:

Horizon22

Established Member
Associate Staff
Jobs & Careers
Joined
8 Sep 2019
Messages
7,584
Location
London
Passenger impact of the Elizabeth line on all rail journeys remains huge, although I do think some of them are harder to quantify and remain guesstimates (nearly 2m for one stop Tottenham Court Rd - Bond St seems excessive). Also key airport flows evident.
 

JW4

Member
Joined
14 Feb 2023
Messages
272
Location
Birmingham
Argyle Street once again manages to have 99.99% of its journeys be within Scotland
But at least it has some passengers to London this time, 2 to Kings Cross.
 

greatkingrat

Established Member
Joined
20 Jan 2011
Messages
2,770
The Barking - West Ham figure has always seemed very dubious. It seems very unlikely that Barking - West Ham is seven times larger than Upminster - West Ham, yet Upminster - Fenchurch Street is larger than Barking - Fenchurch Street?
 

JW4

Member
Joined
14 Feb 2023
Messages
272
Location
Birmingham
Clapham Junction to Clapham High Street
2018/19206,773-
2019/20216,438+9,665 (+4.67%)
2020/2184,999-131,439 (-60.73%)
2021/22182,057+97,058 (+114.19%)
2022/2334,668-147,389 (-80.96%)
Seems they’ve sorted some of the issues.
 

NorthOxonian

Established Member
Associate Staff
Buses & Coaches
Joined
5 Jul 2018
Messages
1,487
Location
Oxford/Newcastle
The Barking - West Ham figure has always seemed very dubious. It seems very unlikely that Barking - West Ham is seven times larger than Upminster - West Ham, yet Upminster - Fenchurch Street is larger than Barking - Fenchurch Street?
The gap is perhaps wider than I'd expect but demographics may be partly responsible.

Upminster is a fairly affluent area on the fringes of Essex, where there will be a lot of commuting into the City; I'd not expect Barking to have as much (the Underground is also much more appealing from Barking with less of a difference in journey times). Another factor may be ethnicity - to put it delicately, West Ham and Barking both have large African, Eastern European, and Bangladeshi communities and these are likely to mean significant family ties. Such connections will be far weaker between West Ham and Upminster, reducing journey numbers further.

I'm not sure how tube journeys are taken into account in the data - I've not used c2c at West Ham so I don't know if this is gated separately to the District and Hammersmith & City platforms. I have taken the train from Barking, where all services are in one gateline, so it may be that tube and rail journeys are conflated here?
 

deltic

Established Member
Joined
8 Feb 2010
Messages
3,225
Nope, already tried that.

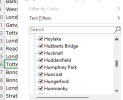
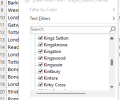
View attachment 153061
Sorry I was looking at the data by local authority where Kingston upon Hull is the council name - Hull is definitely listed in the original station data set I am looking at - see below

How Wood (Hertfordshire)
Howden
13​
Howwood (Renfrewshire)
13​
5​
Hoxton
Hoylake
1​
1​
Hubberts Bridge
Hucknall
4​
Huddersfield
171​
6​
31​
Hull
1198​
38​
130​
Humphrey Park
Huncoat
Hungerford
4​
Hunmanby
1​
Huntingdon
82​
22​
11​
Huntly
12631​
4047​
138​
Hunts Cross
6​
Hurst Green
1​
Hutton Cranswick
4​
Huyton
61​
8​
 

greatkingrat

Established Member
Joined
20 Jan 2011
Messages
2,770
The problem is that data isn't fully sorted and all the rows for Hull are right at the end of the file, therefore if you try and load it into Excel they will be cut off by the 1 million row limit. This also affects other stations such as Bristol Temple Meads or Bournemouth.

It seems to affect any station with a comma in the local authority area - "Kingston upon Hull, City of", "Bournemouth, Christchurch and Poole", "Bristol, City of", "Herefordshire, County of", so I guess that extra comma has thrown off the sorting.
 

Gaelan

Member
Joined
3 Apr 2023
Messages
809
Location
St Andrews
The problem is that data isn't fully sorted and all the rows for Hull are right at the end of the file, therefore if you try and load it into Excel they will be cut off by the 1 million row limit. This also affects other stations such as Bristol Temple Meads or Bournemouth.

It seems to affect any station with a comma in the local authority area - "Kingston upon Hull, City of", "Bournemouth, Christchurch and Poole", "Bristol, City of", "Herefordshire, County of", so I guess that extra comma has thrown off the sorting.
Ah! Well spotted, that will indeed have thrown things off. I’ll do a proper sorted version as time permits.
 

stevieinselby

Member
Joined
26 May 2023
Messages
190
Location
Selby
The problem is that data isn't fully sorted and all the rows for Hull are right at the end of the file, therefore if you try and load it into Excel they will be cut off by the 1 million row limit. This also affects other stations such as Bristol Temple Meads or Bournemouth.

It seems to affect any station with a comma in the local authority area - "Kingston upon Hull, City of", "Bournemouth, Christchurch and Poole", "Bristol, City of", "Herefordshire, County of", so I guess that extra comma has thrown off the sorting.
Ah yes, commas go in CSVs about as well as toasters go in the bath!
As Gaelan had sorted the data so that it was only trivial journeys falling off the bottom, my guess would be that the comma has caused the data to become misaligned and anywhere with a comma in has ended up with an alphabetic value in a numeric field and so has been sorted to the bottom.
 

RailAleFan

Member
Joined
2 Jul 2014
Messages
315
Location
Midlands
Hi all,

I've updated the Flow Statistics Top 100 search tool with the 2022/2023 dataset;


Cheers
 

JW4

Member
Joined
14 Feb 2023
Messages
272
Location
Birmingham
Hi all,

I've updated the Flow Statistics Top 100 search tool with the 2022/2023 dataset;


Cheers
Interesting how Shrewsbury is around the same level as Sandwell & Dudley for Avanti to Euston, while North Wales is behind. Is there a lot of split-ticketing at Chester?

A good tool you’ve got there
 
Last edited:

Nottingham59

Established Member
Joined
10 Dec 2019
Messages
1,656
Location
Nottingham
Ah! Well spotted, that will indeed have thrown things off. I’ll do a proper sorted version as time permits.
Is there any chance of creating a cut-down version of the spreadsheet, please? Say the first 1000 busiest station pairs?

EDIT - I see @RailAleFan has done effectively just that. Thanks
 

PGAT

Established Member
Joined
13 Apr 2022
Messages
1,469
Location
Selhurst
Why is there such a strong flow from Dartford to King's Lynn of all places?
 

TheDavibob

Member
Joined
10 Oct 2016
Messages
407
I've pivotted the linked .csv file to make it quite a lot smaller (though have stripped out a lot of the info, and potentially have squashed out some stations but I'm pretty sure the count is correct). Same licensing caveats apply as per OP.


I haven't carefully checked the output, but it's now a 2575x2575 grid, so can happily be opened in Excel if that's what people prefer.

Some odd things, e.g. the Abbey Wood to Abbey Wood flow that's also in the original data.
 

greatkingrat

Established Member
Joined
20 Jan 2011
Messages
2,770
Some odd things, e.g. the Abbey Wood to Abbey Wood flow that's also in the original data.

I think we decided that represented unresolved Oyster/contactless journeys where someone tapped in but not out or vice versa.
 

etr221

Member
Joined
10 Mar 2018
Messages
1,055
Harder to summarize: several thousand journeys made only once in the year, and several million journeys never made at all.
A quick play on the 2575 * 2575 spreadsheet posted earlier shows (if I understand correctly) 5.18 million out of 6.63 million possibilities were never made (had a figure of 0). One wonders how many have never, ever been made - I would suggest it is probably into the millions. There was a thread fairly recently discussing this, and wondering which ones they were likely to be...

A further play showed less then 200,000 flows exceeded 100, less than 60,000 exceeded 1,000, less than 16,000 exceeded 10,000, just 2,200 exceeded 100,000, and only 78 over 1,000,000. Food for thought...

When I was looking at the TfL/LU stats for 2021 (based on Oyster usage), I determined 1065 of 71289 possible journeys had not been made (there were several oddities in the data).
 
Last edited:

Killingworth

Established Member
Joined
30 May 2018
Messages
4,892
Location
Sheffield
In 2019-20 2,391 went between Dore & Totley and Manchester Oxford Road. In 2022-23 none seem to have been recorded.

Many Manchester University academic staff used to commute from Sheffield and some still do, although far fewer every day. It seems the Oxford Road figures must have been consolidated with Piccadilly.
 

infobleep

Veteran Member
Joined
27 Feb 2011
Messages
12,672
Hi all,

I've updated the Flow Statistics Top 100 search tool with the 2022/2023 dataset;


Cheers
Many thanks for this. It is very interesting.

Clapham Junction to Guildford is 23rd on the Clapham Junction list. It has 1 fast train an hour off peak most hours Monday to Friday and 3 stopping trains. Kingston [upon Thames] is 28th on the list and has 4 trains an hour more direct and 2 that take longer but show up in the journey planner search. All stopping services but it is closer to Clapham Junctiom.

Goes to show, just because you have the higher passenger numbers, doesn't mean it is always possible to provide a better service.

The high number of local journeys in these lists surprised me but perhaps it shouldn't do.

This is being used to help with timetable revisions and any future changes?
 

Top