Does anyone else want to recreate the fish slapping dance from Monty Python with Boris substituting for Michael Palin?Probably but Boris will be too arrogant to notice. Too busy counting fish.
-
Our new ticketing site is now live! Using either this or the original site (both powered by TrainSplit) helps support the running of the forum with every ticket purchase! Find out more and ask any questions/give us feedback in this thread!
You are using an out of date browser. It may not display this or other websites correctly.
You should upgrade or use an alternative browser.
You should upgrade or use an alternative browser.
Our total reliance on a vaccine and putting life on hold until it's rolled out
- Thread starter yorkie
- Start date
- Status
- Not open for further replies.
Sponsor Post - registered members do not see these adverts; click here to register, or click here to log in
R
RailUK Forums
Do you have a source for that by any chance? I'd love to believe that the UK manages to give 60% of the population the flu vaccine but I'm struggling to. For example they talk about 25million being offered it for free on the NHS which is only 45% of the population assuming that everyone offered it takes it. I struggle to imagine that a further 15% (if not more) would voluntarily seek it out and pay for it
Typically I can't find the data again now I'm looking.
However if we rerun the maths at 45/100 and then taking out those under 18, so 45/75 in a 4 month period we'd get 60% in 4 months with single vaccine, so 60% in 8 months with two doses.
Scale that up to 12 months and it's 90% of people. That's probably higher than you'd actually get anyway.
Even at 35% you end up at 70% of people, which would probably be a fairly typical take up rate.
As such 12 months should be achievable, subject to supply.
Whilst you're right that there's likely to be quite a few who wouldn't go out and pay for the flu vaccine, it should be remembered that some companies offer it to their staff (as it's cheaper to pay for the vaccines for everyone than it is for lost days due to sickness). Which would increase the numbers quite a bit.
brad465
Established Member
I wasn't sure which thread to put this in but thought I'd share one of Hugh Dennis' jokes from the Mock the Week Christmas Special just now about Chris Whitty: "...in Harry Potter terms he is an optimism Dementor".
Pete_uk
Established Member
Two doctors surgeries get the vaccine near me today. That made me smile to think back to when the first local cases of Covid-19 were discovered.
notlob.divad
Established Member
- Joined
- 19 Jan 2016
- Messages
- 1,609
Interesting that this mutation with a higher R number was found going into the autumn, when respiratory viruses naturally spread more due to people moving inside.
Yes. My long term concern was getting through this winter because all sorts of infections have a better time of it when we are close together in un-ventilated areas. I was a bit surprised how early Covid-19 got going on its second wave. The 2nd lockdown slowed that down but, whatever has caused it, the curve on the graph makes the results of the 2nd lockdown look like a blip on the rising trend. I was also pleasantly surprised that we have vaccines available so soon. But not quite soon enough !.
Undoubtadly the UK health system is under more strain between October and March, however sticking religiously to this Winter - Summer thing is not helpful. How would that explain the recent significant rise (believed to be driven by this new varient) in South Africa? Believing Covid-19 would behave exactly like seasonal influenza is what got the UK into such a mess in the first place. Don't make the same mistake again.
I can't remember the name of the type of curve, but my understanding is that typically diseases follow a different pattern in the tropics (or close to them, in the case of SA) and of course the million other factors that I can't say offhand, as I've not been following SA in detail.Undoubtadly the UK health system is under more strain between October and March, however sticking religiously to this Winter - Summer thing is not helpful. How would that explain the recent significant rise (believed to be driven by this new varient) in South Africa? Believing Covid-19 would behave exactly like seasonal influenza is what got the UK into such a mess in the first place. Don't make the same mistake again.
I can't remember the name of the type of curve, but my understanding is that typically diseases follow a different pattern in the tropics (or close to them, in the case of SA) and of course the million other factors that I can't say offhand, as I've not been following SA in detail.
Indeed - looking at the states of the USA is a nice way of showing this seasonality pattern - in Spring, it was the northeast and northwest that was most affected, in summer the south, in autumn the midwest. The correlation is quite strong.
brad465
Established Member
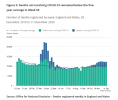
The latest weekly registered deaths' report from the ONS is out, and while deaths are in excess, they're only slightly above average on the face of it, and looking at the graph below what caught my eye is that a chunk of the Covid-19 classed deaths, perhaps as much as half, are actually within the average and therefore not excess:

Deaths registered weekly in England and Wales, provisional - Office for National Statistics
Provisional counts of the number of deaths registered in England and Wales, including deaths involving the coronavirus (COVID-19) pandemic, by age, sex and region.
www.ons.gov.uk

- Status
- Not open for further replies.
