• Our booking engine at tickets.railforums.co.uk (powered by TrainSplit) helps support the running of the forum with every ticket purchase! Find out more and ask any questions/give us feedback in this thread!

Vaccine Progress, Approval, and Deployment

Status
Not open for further replies.
Sponsor Post - registered members do not see these adverts; click here to register, or click here to log in
R

RailUK Forums

Nicholas Lewis

Established Member
Joined
9 Aug 2019
Messages
6,182
Location
Surrey
The local rag is reporting that 100% (!) of 75 to 79 year olds in Cambridgeshire have been vaccinated.

https://www.cambridge-news.co.uk/ne...geshire-covid-vaccine-figures-latest-19821101


Somehow I feel this is a bit unlikely, and somewhere along the line 'offered a vaccination' is being conflated with 'having a vaccination'.

I wonder if this is just the awful editoral standards of the local paper, or is this sort of misleading statistic about 'delivered' vaccinations a more widespread phenomenon?
NHS weekly vaccination statistics show that 100% of SW Region 75-79 year olds have received 1st dose so its possible.

What's also interesting is that the 75-79 age group 1st dose rate is above the 80+ rate in all regions of England.

Note the data cut is 9/2 so will have improved further.

Im seeing fastest trend down in hospitalisation rates in the 75-85 age group as reported on Covid dashboard so this may be showing some benefit from vaccination levels now.

Ive had a friend who is 60 been called for his 1st dose already as the local team are just working there way down the list. Experts say we needed 70% vaccination levels to deliver immunity and we are way above that so they need to stop chasing down the few that they haven't got and prioritise those that want it down each age group so we get to everyone above 50 well before end of April.
 

MikeWM

Established Member
Joined
26 Mar 2010
Messages
4,428
Location
Ely
NHS weekly vaccination statistics show that 100% of SW Region 75-79 year olds have received 1st dose so its possible.

No, that clearly isn't possible. It may be a very high % but there is no way whatsoever that *every single person* in that age group has been vaccinated. Some people will have been unwilling, some people will have been unable, some people will have been overlooked by accident.
 

Nicholas Lewis

Established Member
Joined
9 Aug 2019
Messages
6,182
Location
Surrey
No, that clearly isn't possible. It may be a very high % but there is no way whatsoever that *every single person* in that age group has been vaccinated. Some people will have been unwilling, some people will have been unable, some people will have been overlooked by accident.
Technically its 99.95% as its 237458 have received 1st dose out of population of 237565. Im a bit dubious myself but all the other regions are above 95% except London but there lagging behind in all age groups.
The wider point im making is takeup is way above 70% threshold needed to bring virus under control so we should be able to accelerate relaxation of restrictions although that can't be dated until the govt defines the criteria its going to use on 22 Feb.

SAGE data released today confirms 2% of deaths occur in <50 year olds which rises to c6% <60 year olds. So we are close to achieving >60 year olds 1st dose thus offering the potential to mitigating over 90% of deaths yet they are proposing to keep restrictions on well into Spring should be challenged. I do hope that the 1922 committee will be consulted over Boris's roadmap before 22/2 so it has a reality check over the principles.
 

Simon11

Established Member
Joined
7 Nov 2010
Messages
1,335
Latest figures show a total of 14,012,224 people have received a first dose of a Covid vaccine in the UK, with 503,116 getting their jab on Thursday.

Another fantastic day yesterday with vaccinations and I look forwards to big cheers when we reach 15 million, which I think will come a day early, thus hopefully by Sunday at 4pm as this rate!
 

hwl

Established Member
Joined
5 Feb 2012
Messages
7,413
Technically its 99.95% as its 237458 have received 1st dose out of population of 237565. Im a bit dubious myself but all the other regions are above 95% except London but there lagging behind in all age groups.
The wider point im making is takeup is way above 70% threshold needed to bring virus under control so we should be able to accelerate relaxation of restrictions although that can't be dated until the govt defines the criteria its going to use on 22 Feb.

SAGE data released today confirms 2% of deaths occur in <50 year olds which rises to c6% <60 year olds. So we are close to achieving >60 year olds 1st dose thus offering the potential to mitigating over 90% of deaths yet they are proposing to keep restrictions on well into Spring should be challenged. I do hope that the 1922 committee will be consulted over Boris's roadmap before 22/2 so it has a reality check over the principles.
The other big problems is hospitalisation and in particular Intensive Care:
The latest covid intensive care stats (weekly):

Mean age at admission: 59.5
Median age at admission: 61
25% are over 69
25% are under 51

Vaccinating everyone in groups 1-4 will only reach 34% of those at risk of ICU admission (then there won't be 100% take up and the vaccine effectiveness at reducing serious cases is very good but probably not the 100% seen in the trial due to the smallish relative numbers in trials to assess potential serious cases and typical lower vaccine effectiveness in older people).

The effect of vaccination on reducing ICU admission is far slower than that on reducing deaths.
 

WelshBluebird

Established Member
Joined
14 Jan 2010
Messages
4,924
The effect of vaccination on reducing ICU admission is far slower than that on reducing deaths.
Without wanting to be too morbid, I assume that is because at least some of those deaths either won't make it as far as ICU anyway (either because sadly they have already passed away beforehand, or because they are deemed too frail for the whole ICU experience - which is pretty damn rough on the body).

25% are under 51

I've seen some data suggesting that 45 or so is where hospitilsations really start to drop off for otherwise healthy adults, though I can't find it now so I'd be interested to see if that is actually true or not.
 

Yew

Established Member
Joined
12 Mar 2011
Messages
6,560
Location
UK
The other big problems is hospitalisation and in particular Intensive Care:
The latest covid intensive care stats (weekly):

Mean age at admission: 59.5
Median age at admission: 61
25% are over 69
25% are under 51
I can already hear the goalposts moving again.
 

6862

Member
Joined
3 Dec 2014
Messages
506
I can already hear the goalposts moving again.

If you listen carefully you can hear the politicians struggling to lift them over the (closed, due to lockdown) gates of the stadium we were playing in, so they can take them down the street to play on a different pitch.
 

Yew

Established Member
Joined
12 Mar 2011
Messages
6,560
Location
UK
If you listen carefully you can hear the politicians struggling to lift them over the (closed, due to lockdown) gates of the stadium we were playing in, so they can take them down the street to play on a different pitch.
Sounds heavy, perhaps we could arrange for the RAF to lend them a helicopter.

As a complete aside, a Helicopter Display team would be awesome, like the RAF, but low down, close, and hovery.
 

35B

Established Member
Joined
19 Dec 2011
Messages
2,296
I can already hear the goalposts moving again.
Or a realistic view of where the epidemiology actually shows risk lying? That shows that ICU admissions for Covid are concentrated in a 20 year band, in what may well be a bit of a bell curve distribution by age (presumably skewed towards the old). It would be good to have some hard numbers attached to those percentages, relating back to underlying NHS capacity pre-Covid.

I'm delighted that so many have been vaccinated, and that the highest risk part of the population is being removed from the risk equation. But if volumes are still high - I think I saw a figure of 750,000 cases today - then that still represents significant risk to "ordinary people", both directly and through the knock on impact of Covid driven pressures on healthcare. During the vaccination programme, it also shifts the emphasis if measuring on QALY type measures - if I have 20 working years left, and 40 years life expectancy, but my father has a life expectancy at his current age of 15 years, a QALY calculation will start to make more intensive measures appear better value as the emphasis on who is protected by restrictions changes.
 

Bantamzen

Established Member
Joined
4 Dec 2013
Messages
9,784
Location
Baildon, West Yorkshire
The other big problems is hospitalisation and in particular Intensive Care:
The latest covid intensive care stats (weekly):

Mean age at admission: 59.5
Median age at admission: 61
25% are over 69
25% are under 51

Vaccinating everyone in groups 1-4 will only reach 34% of those at risk of ICU admission (then there won't be 100% take up and the vaccine effectiveness at reducing serious cases is very good but probably not the 100% seen in the trial due to the smallish relative numbers in trials to assess potential serious cases and typical lower vaccine effectiveness in older people).

The effect of vaccination on reducing ICU admission is far slower than that on reducing deaths.
So I am assuming these are "with covid" cases? Any data on other conditions at the time of admission?
 

Domh245

Established Member
Joined
6 Apr 2013
Messages
8,426
Location
nowhere
I can already hear the goalposts moving again.

I would expect(/hope) that most of those 25% are vulnerable (or CEV) and thus already covered by the vaccination programme

So I am assuming these are "with covid" cases? Any data on other conditions at the time of admission?

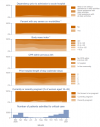
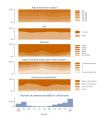
They're "confirmed covid-19" cases. There's supporting data around very severe comorbidities, BMI and a few other things in the report (available here) although the interesting thing to see is that the numbers are for all cases since 1st September! There are some trend data presented in graphical format but they just show distributions of ages/comorbdities etc:

1613150233151.png1613150241991.png

very severe comorbidity definition used:

Very severe comorbidities must have been evident within the six months prior to critical care and documented at or prior to critical care:
• Cardiovascular: symptoms at rest
• Respiratory: shortness of breath with light activity or home ventilation
• Renal: renal replacement therapy for end-stage renal disease
• Liver: biopsy-proven cirrhosis, portal hypertension or hepatic encephalopathy
• Metastatic disease: distant metastases
• Haematological malignancy: acute or chronic leukaemia, multiple myeloma or lymphoma
• Immunocompromise: chemotherapy, radiotherapy or daily high dose steroid treatment in previous six months, HIV/AIDS or congenital immune deficiency
 

Bantamzen

Established Member
Joined
4 Dec 2013
Messages
9,784
Location
Baildon, West Yorkshire
I would expect(/hope) that most of those 25% are vulnerable (or CEV) and thus already covered by the vaccination programme


They're "confirmed covid-19" cases. There's supporting data around very severe comorbidities, BMI and a few other things in the report (available here) although the interesting thing to see is that the numbers are for all cases since 1st September! There are some trend data presented in graphical format but they just show distributions of ages/comorbdities etc:

View attachment 90487View attachment 90488

very severe comorbidity definition used:
I would really rather see data on the different age ranges with confirmed covid prior to admission versus other conditions. Some data analyst has had a field day on Qlik with all those charts, but they are more PowerPoint candy than anything revealing.
 

hwl

Established Member
Joined
5 Feb 2012
Messages
7,413
I would really rather see data on the different age ranges with confirmed covid prior to admission versus other conditions. Some data analyst has had a field day on Qlik with all those charts, but they are more PowerPoint candy than anything revealing.
A good few data tables in the report if you don't like charts. I would prefer more hard numbers too.
They have done other non-covid reports too for the last 25 years.

I would expect(/hope) that most of those 25% are vulnerable (or CEV) and thus already covered by the vaccination programme
Sadly not, from what I have seen elsewhere less than 8-9% overall are under 70 and vulnerable (I've seen 2 analysis that put vaccination groups 1-4 at 33% and 34% of ICU admissions). Which is what has scared Hancock etc.

It is going to take while for vaccination to have significant impact on ICU, the big determinant will be new case numbers with lag for quite while yet.

We are 9.5 weeks into vaccination so the second dose wave will start to hit in the next few weeks so the number of daily first dose may fall off quiet a bit
 

35B

Established Member
Joined
19 Dec 2011
Messages
2,296
A good few data tables in the report if you don't like charts. I would prefer more hard numbers too.
They have done other non-covid reports too for the last 25 years.


Sadly not, from what I have seen elsewhere less than 8-9% overall are under 70 and vulnerable (I've seen 2 analysis that put vaccination groups 1-4 at 33% and 34% of ICU admissions). Which is what has scared Hancock etc.

It is going to take while for vaccination to have significant impact on ICU, the big determinant will be new case numbers with lag for quite while yet.

We are 9.5 weeks into vaccination so the second dose wave will start to hit in the next few weeks so the number of daily first dose may fall off quiet a bit
A tad depressing, but worth seeing the rounded picture of what is actually happening, rather than what we hope is happening.
 

ainsworth74

Forum Staff
Staff Member
Global Moderator
Joined
16 Nov 2009
Messages
27,764
Location
Redcar
My sixty-seven year old mother got a call off her GP surgery this afternoon arranging for her to have her first vaccine next Tuesday. So they've definitely started in on group five members!
 

hwl

Established Member
Joined
5 Feb 2012
Messages
7,413
A tad depressing, but worth seeing the rounded picture of what is actually happening, rather than what we hope is happening.
Indeed but the Hancock / DoH point of view makes much more sense when you know that.
 

35B

Established Member
Joined
19 Dec 2011
Messages
2,296
Indeed but the Hancock / DoH point of view makes much more sense when you know that.
Indeed. Which is I why I struggle with those who just treat the scientists as single issue fanatics, and don't allow for the possibility of the complexity they're having to consider.
 

Nicholas Lewis

Established Member
Joined
9 Aug 2019
Messages
6,182
Location
Surrey
The other big problems is hospitalisation and in particular Intensive Care:
The latest covid intensive care stats (weekly):

Mean age at admission: 59.5
Median age at admission: 61
25% are over 69
25% are under 51

Vaccinating everyone in groups 1-4 will only reach 34% of those at risk of ICU admission (then there won't be 100% take up and the vaccine effectiveness at reducing serious cases is very good but probably not the 100% seen in the trial due to the smallish relative numbers in trials to assess potential serious cases and typical lower vaccine effectiveness in older people).

The effect of vaccination on reducing ICU admission is far slower than that on reducing deaths.
The age of people in ICU is not a key metric and if we start looking for metrics to focus on we will never get out of this. Whats important, or should be, is what level the NHS can sustain and still provide its other services. Also what we do know is there will be a long tail ICU with the better treatments now available. It maybe still too high but its declining.

Whats key is the level of admissions and those hospitalised and both these are down 20% again across the week with definite downtrend that a reasonable forecast can be made by the modellers to help inform govt thinking on timelines.

Govt need to take the positives here vaccination on plan, cases down, positivity down, admissions down, hospitalised down, ICU down and start to lift restrictions from end of the month.
 
Last edited:

Yew

Established Member
Joined
12 Mar 2011
Messages
6,560
Location
UK
Indeed. Which is I why I struggle with those who just treat the scientists as single issue fanatics, and don't allow for the possibility of the complexity they're having to consider.
But they are, their job isn't to weigh up the economic impacts, that's the job of the government. Unfortunately Boris seems severely lacking on the balance front.
 

hwl

Established Member
Joined
5 Feb 2012
Messages
7,413
Hospitalised is down 20% this week across the UK

The age of people in ICU is not a key metric and if we start looking for metrics to focus on we will never get out of this. Whats important, or should be, is what level the NHS can sustain and still provide its other services. Also what we do know is there will be a long tail ICU with the better treatments now available. It maybe still too high but its declining.

Whats key is the level of admissions and those hospitalised and both these are down 20% again across the week with definite downtrend that a reasonable forecast can be made by the modellers to help inform govt thinking on timelines.

Govt need to take the positives here vaccination on plan, cases down, positivity down, admissions down, hospitalised down, ICU down and start to lift restrictions from end of the month.
Age isn't the key metric, it is only a key metric if you are looking at how long it will take vaccination to make a significant impact on ICU admissions which is the point being discussed...

The current main driver for reduced hospitalisations /ICU admissions is reduced case numbers with R less than 1 due to restrictions.
 

Domh245

Established Member
Joined
6 Apr 2013
Messages
8,426
Location
nowhere
Whats key is the level of admissions and those hospitalised and both these are down 20% again across the week with definite downtrend that a reasonable forecast can be made by the modellers to help inform govt thinking on timelines.

Govt need to take the positives here vaccination on plan, cases down, positivity down, admissions down, hospitalised down, ICU down and start to lift restrictions from end of the month.

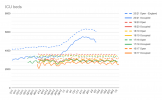
ICU is down, but still well above anywhere sustainable

1613159108457.png
(noting that the graphs for previous years are underestimates because of the way I've added up by trusts which have changed over the years!)
 

35B

Established Member
Joined
19 Dec 2011
Messages
2,296
But they are, their job isn't to weigh up the economic impacts, that's the job of the government. Unfortunately Boris seems severely lacking on the balance front.
The scientists are specialists, I agree, and their role is to give their expert advice to government. While I'm sure some are also single issue fanatics, I tend to the view that most are rather more balanced and recognise that their individual disciplines are each part of a larger picture.

How their parts of the picture weigh up against other, non scientific, factors is hard to tell. But I would suggest that the last year shows that if anything Boris has been bending over backwards to the opponents of restrictive measures. Given the shape of the graph posted by @Domh245 above, I'd suggest we're on a path towards sustainability, but not there yet.
 

Domh245

Established Member
Joined
6 Apr 2013
Messages
8,426
Location
nowhere
When sustainable become the criteria, we're not suggesting we keep this level of ICU level permanently...

Clearly, but ICU occupation certainly is the laggiest (and least proportional to case rates as far as I can tell) so the fact that everything else is falling rapidly can't be used to justify the relaxing of restrictions just yet. London (yet again) remains remarkably flat in comparison to the national situation for example
 

Nicholas Lewis

Established Member
Joined
9 Aug 2019
Messages
6,182
Location
Surrey
ICU is down, but still well above anywhere sustainable

View attachment 90495
(noting that the graphs for previous years are underestimates because of the way I've added up by trusts which have changed over the years!)
Firstly is Open total capacity?

As i said its too high currently but im interested in where its headed to inform policy and timelines. So there is good correlation between cases, hospital admissions and ICU occupancy with a lag of 2 weeks roughly between each of them. So you can forecast that with cases down over last few weeks hospitalisations reducing that ICU bed occupancy will react accordingly. Yes it will stay at a high level because its has a long decline tail but as long as its declining then absolute numbers shouldn't be a reason for keeping full restrictions in place. .
 

Yew

Established Member
Joined
12 Mar 2011
Messages
6,560
Location
UK
Clearly, but ICU occupation certainly is the laggiest (and least proportional to case rates as far as I can tell) so the fact that everything else is falling rapidly can't be used to justify the relaxing of restrictions just yet. London (yet again) remains remarkably flat in comparison to the national situation for example
It doesn't only lag on the way down, you know?
 
Status
Not open for further replies.

Top